
Predicting Emergency Department Triage Acuity
Published:
Developing machine learning models to predict Emergency Department mistriage and identify the hidden clinical factors that compromise patient safety.
Overview
- Goal: Developed a predictive model to identify hospital emergency department mistriage (discrepancies between initial triage and final diagnosis) to reduce patient mortality and system bottlenecks.
- Data: Processed a clinical dataset of 1,216 records, performing rigorous cleaning of non-standard entries and handling a 14% class imbalance.
- Technical Highlight: Conducted custom text feature engineering to convert free-text chief complaints and diagnoses into 16 distinct clinical categories (e.g., CC_systemic_infectious).
- Modeling & Insights: Evaluated Random Forest, Logistic Regression, and Naive Bayes models. While supervised models faced high signal-to-noise ratios, unsupervised t-SNE and K-means analysis revealed a high data purity score (0.8569), proving the existence of strong underlying structural patterns in patient presentations.
- Key Finding: Identified that specific clinical diagnoses (Neurological and Infectious) are stronger predictors of mistriage than standard physiological vitals, providing a roadmap for future triage-support tools.
- Repository located at the following link
https://github.com/erincameron11/emergency-triage-status
Executive Summary
This project analyzed Emergency Department (ED) triage data to predict an under- or over-estimation of patient acuity, called mistriage. Despite a robust methodology involving custom text feature engineering converting free-text complaints and diagnoses into binary categories and advanced imbalance handling through Synthetic Minority Over-sampling Technique (SMOTE), all supervised models demonstrated very limited predictive reliability.
The most robust model, Random Forest classifier with SMOTE, achieved a peak Receiver Operating Characteristic - Area Under the Curve (ROC-AUC) score of 0.6766. However, its clinical utility was undermined by critically low Recall (≤0.05 on the final model), meaning the vast majority of true mistriage cases were missed. Exploratory analysis using T-distributed Stochastic Neighbor Embedding (t-SNE) found the data to possess a strong underlying separation aligned with the true outcome (purity score: 0.8569). This suggests the predictive power is limited not by data quality, but by a weak signal-to-noise ratio in the available features, which were prone to be dominated by noisy variables (Length of stay_min, DBP, etc.) rather than clinical variables (DG_ categories, etc.).
Background & Importance
Emergency Departments (ED) play a vital role in providing acute medical care to the public, yet they continue to experience increasing strain due to rising patient volumes, staff shortages, and delays in access to inpatient beds. The triage process of classifying patients based on urgency is a fundamental concept to ensure that critically ill patients are treated promptly. However, triage accuracy can vary depending on clinical judgment, workload, and patient presentation, often leading to mistriage. Mistriage refers to instances where patient acuity is under- or over-estimated. Within this project, mistriage was defined as any discrepancy between initial KTAS nurse assignment and the final reference triage level, encompassing both under-triage and over-triage.
This project addresses the health informatics problem of predicting ED triage acuity using machine learning to mitigate these occurrences. The importance of this work is underscored by severe consequences associated with triage failure: under-triaged patients face dangerous delays, and over-triaged patients contribute to resource bottlenecks and crowding. Studies have directly linked prolonged ED waits and crowding to increased short-term mortality and adverse patient outcomes (Guttmann et al., 2011). Therefore, improving triage accuracy through predictive models that analyze patient demographics, vital signs, and chief complaints has the potential to enhance patient outcomes, optimize resource allocation, and reduce system strain within emergency care delivery.
Methodology
Data Extraction, Cleaning & Preprocessing:
The raw dataset required several critical preprocessing steps to prepare it for effective machine learning analysis. Initially, the file was loaded using the specific “encoding=’windows-1252’” parameter to ensure all special characters, including those used for non-standard data entries, were interpreted correctly.
A major focus of the cleaning process was handling missing and erroneous values. The subjective NRS_pain column contained a significant number of non-standard ‘#BOÞ!’ entries, which were first converted to standard NaN values. For imputation, these were filled with the nearest whole number average of 2, deemed the most clinically appropriate single measure for this pain scale. Furthermore, the six core vital sign columns (Systolic Blood Pressure (SBP), Diastolic Blood Pressure (DBP), Heart Rate (HR), Respiratory Rate (RR), Body Temperature (BT), and Saturation) all contained non-standard ‘??’ values. These were converted to NaN, and the corresponding records were subsequently eliminated using ‘dropna()’, resulting in a final dataset of 1216 patients (1042 Correctly Triaged and 174 Mistriaged).
Data type integrity was also maintained. The KTAS duration_min column, which originally had comma-separated decimals (e.g., “4,00”), was corrected to period-separated decimals before being cast to the numerical ‘int64’ datatype (e.g., “4.00”). Additionally, a critical cleaning step involved the Length of stay_min column, where 17 records containing severe outlier values (between ∼697775–709510 minutes) were identified as probable data entry errors and eliminated, thus preserving the reliability of all time-based features.
Finally, the unstructured clinical data columns were transformed into model-compatible features. The free-text Chief_complain and Diagnosis in ED columns were converted into 16 distinct binary categories (prefixed as CC_ and DG_) using keyword matching. For example, the ‘CC_systemic_infectious’ category was created by matching keywords such as ‘fever,’ ‘sepsis,’ or ‘infection’ in the free-text Chief_complain column. For the remaining categorical variables, specifically the KTAS_RN and Injury type, One-Hot Encoding was applied using ‘pd.get_dummies(…, drop_first=True)’. This process created binary indicator columns while dropping the first category (e.g., KTAS_RN_1) to serve as the reference group, effectively mitigating the risk of multicollinearity.
Machine Learning Model Selection & Design:
For the core task of classifying mistriage, three distinct supervised machine learning models were selected to evaluate the predictive performance. Logistic Regression (LR) was chosen as the primary baseline due to its inherent interpretability and speed, providing a linear method to estimate the probability of mistriage. The second model was Naive Bayes, specifically the Bernoulli Naive Bayes (BNB) variant, which is well-suited for the project’s high number of binary features (the CC_ and DG_ variables). It provides a probabilistic approach based on feature independence, offering a different, computationally efficient baseline. The final model selected was the Random Forest (RF) classifier, an ensemble method known for its robustness, ability to capture complex non-linear relationships.
For unsupervised machine learning, t-SNE and K-means clustering were implemented to explore the data’s inherent separability and hidden structural patterns prior to supervised modeling. The modeling process focused on optimizing for the minority class (Mistriage) and ensuring robust performance. All models were initially trained and tested, revealing a severe initial recall of only 3% for the mistriage class due to the data’s inherent imbalance. To address this, SMOTE was applied to the training data to balance the class distribution, improving the models’ ability to detect the minority class. Subsequently, the RF model was chosen for final optimization.
Cohort Characteristics:
Based on the data cleaning and exploration phase, the final patient cohort consisted of 1,216 records, specifically 1,042 Correctly Triaged patients and 174 Mistriaged patients, establishing a class imbalance (~14%) that defined the modeling strategy. In terms of demographics, the two groups had similar mean ages, with a minor difference: the average age for mistriaged patients was 58.0 years, compared to 56.5 years for the correctly triaged group. The exploratory analysis confirmed that a strong distinguishing feature category was the Chief_complain (prefix CC_) variables. For example, patients presenting with a systemic infectious diagnosis had a significantly high proportion of mistriage at 23.86%, suggesting the clinical importance of this category as a primary predictive factor. Conversely, most physiological variables showed highly similar mean values between the two groups, suggesting their predictive strength was initially weak.
Results
The initial classification attempts used simpler, linear models for baseline comparison. Both Logistic Regression (LR) with L1 regularization and Bernoulli Naive Bayes (BNB) demonstrated low predictive power, yielding ROC-AUC scores of 0.6100 and 0.6050, respectively. Given this low performance, the Random Forest (RF) classifier was implemented to capture the non-linear feature interactions essential in complex clinical data. The RF model without balancing or pruning performed poorly, exhibiting a significantly low Mistriage Recall of 0.03. Implementing SMOTE successfully increased the model’s global ranking ability, achieving the project’s peak ROC-AUC score of 0.6766 and slightly improving Mistriage Recall to 0.05. However, subsequent efforts to stabilize the model by applying feature pruning resulted in a dramatic drop in global performance.
Performance Comparison using Key Metrics:
Given the extreme class imbalance (only ~14% of patients were mistriaged), evaluation focused on Balanced Accuracy, F1-Score, and Recall for the minority class (label “1” = mistriaged). Overall accuracy was highest for the RF model at 83%, but this figure is misleading because it heavily favors the majority class.
- The LR model demonstrated the best global performance trade-off, achieving the highest Balanced Accuracy at 57.2%. BNB followed closely with a Balanced Accuracy of 57.1%. The RF model, despite its high overall accuracy, had the lowest Balanced Accuracy at 51.0%.
- Critically, the RF model yielded a disastrously low Recall of only 0.05 for the minority class. This means over 95% of true mistriage cases were missed, rendering the model clinically unacceptable.
- When assessing class-specific performance, correctly triaged patients (“0” label) had universally higher accuracy and lower Hamming Loss across all three algorithms, suggesting they are predicted more accurately due to the larger amount of data available for this class.
- F1 score is the most informative metric to assess model performance when the classes are imbalanced and unevenly distributed as in this healthcare dataset. LR has the highest F1 score for mistriaged patients (0.2919) and RF has the highest F1 score for correctly triaged patients (0.9069), making either of these two models contenders for the best performing algorithm.
Subsequent efforts to stabilize the RF model by applying feature pruning resulted in a dramatic drop in global performance, lowering the ROC-AUC to 0.6020. While this pruning step successfully increased the Mistriage Recall to 0.14 (catching 14% of true cases), the Mistriage Precision fell from 0.22 to 0.15, suggesting the benefit of increased recall was negated by a high rate of false alarms.
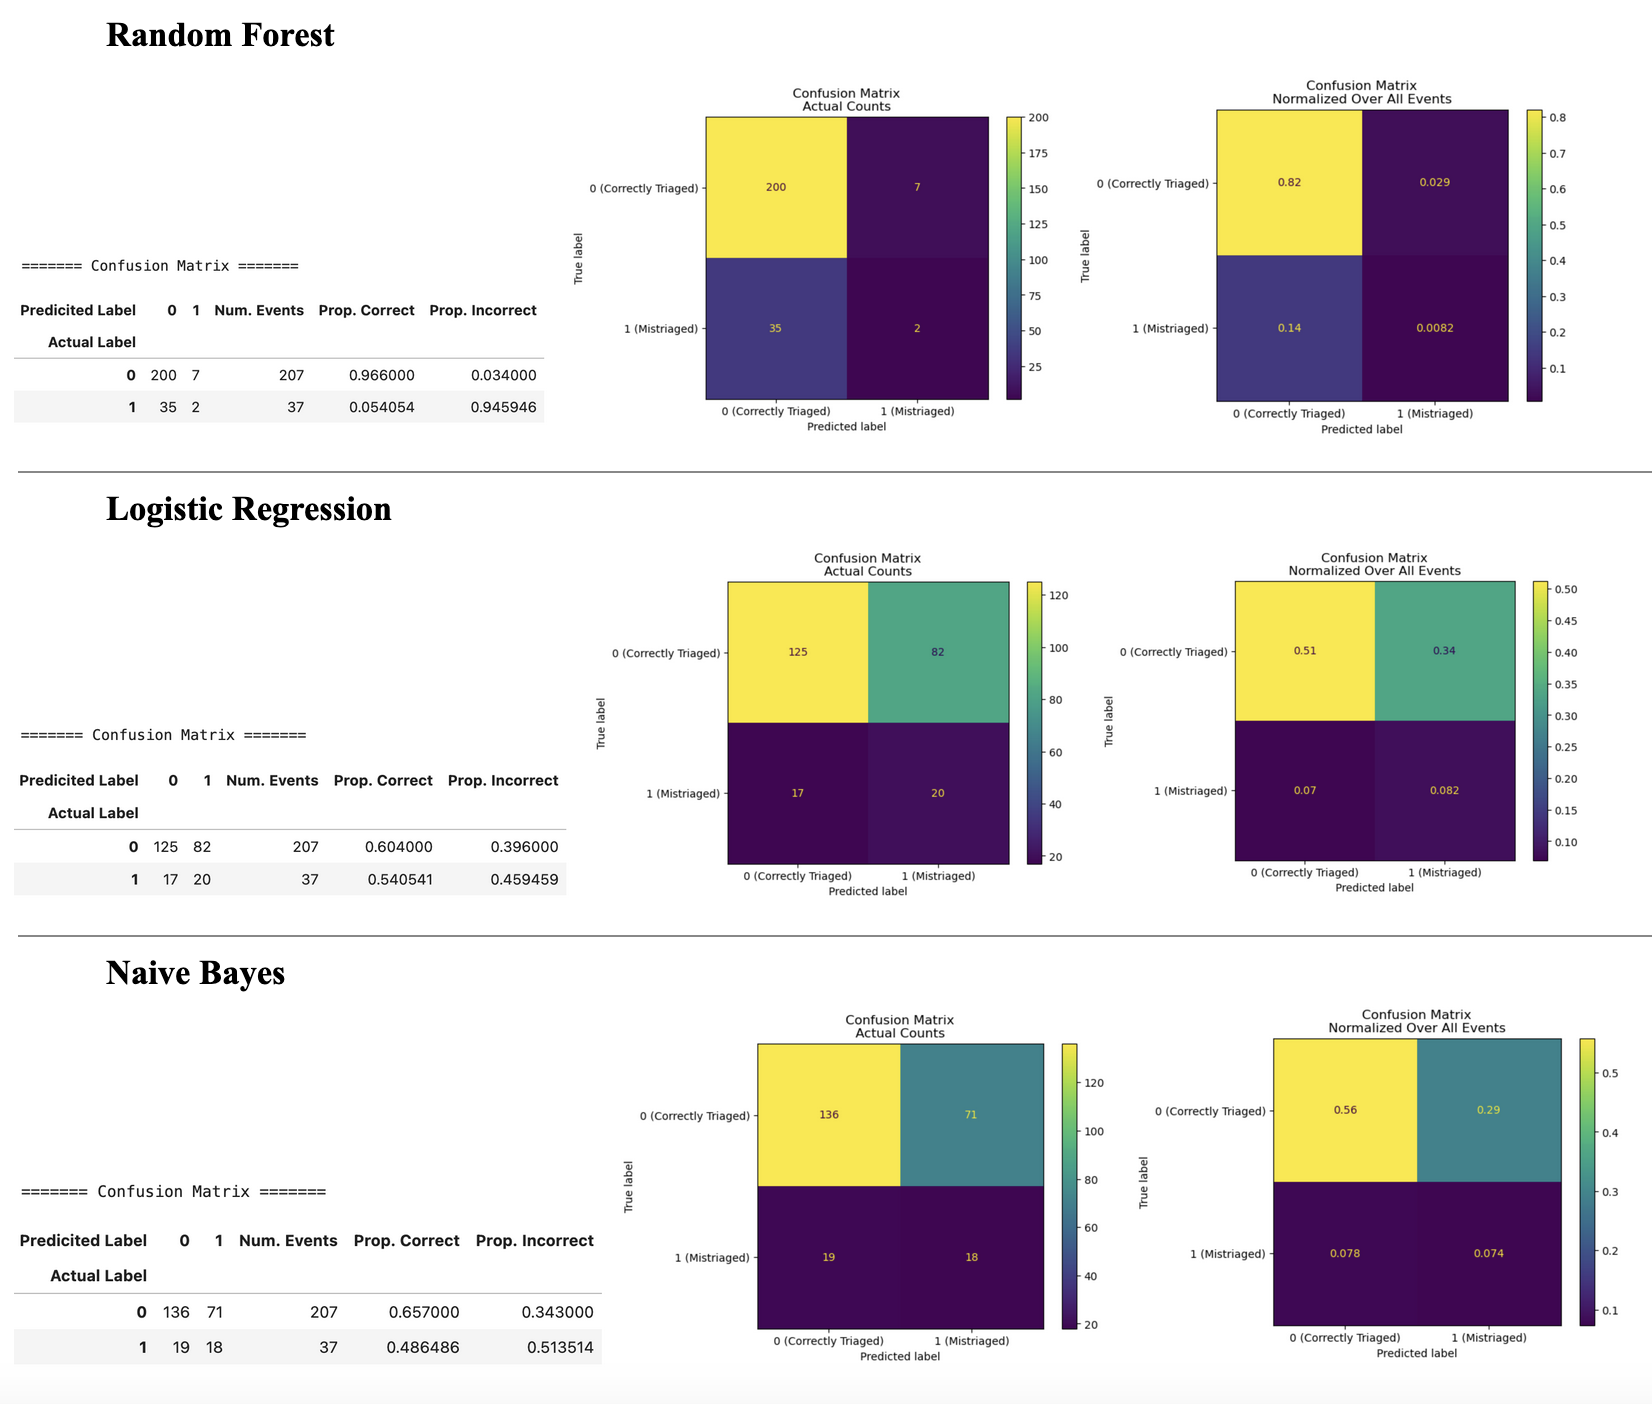
Figure 1: Confusion matrices and heatmap visualizations of actual vs. predicted labels for each algorithm. “0” = correctly triaged, “1” = mistriaged.
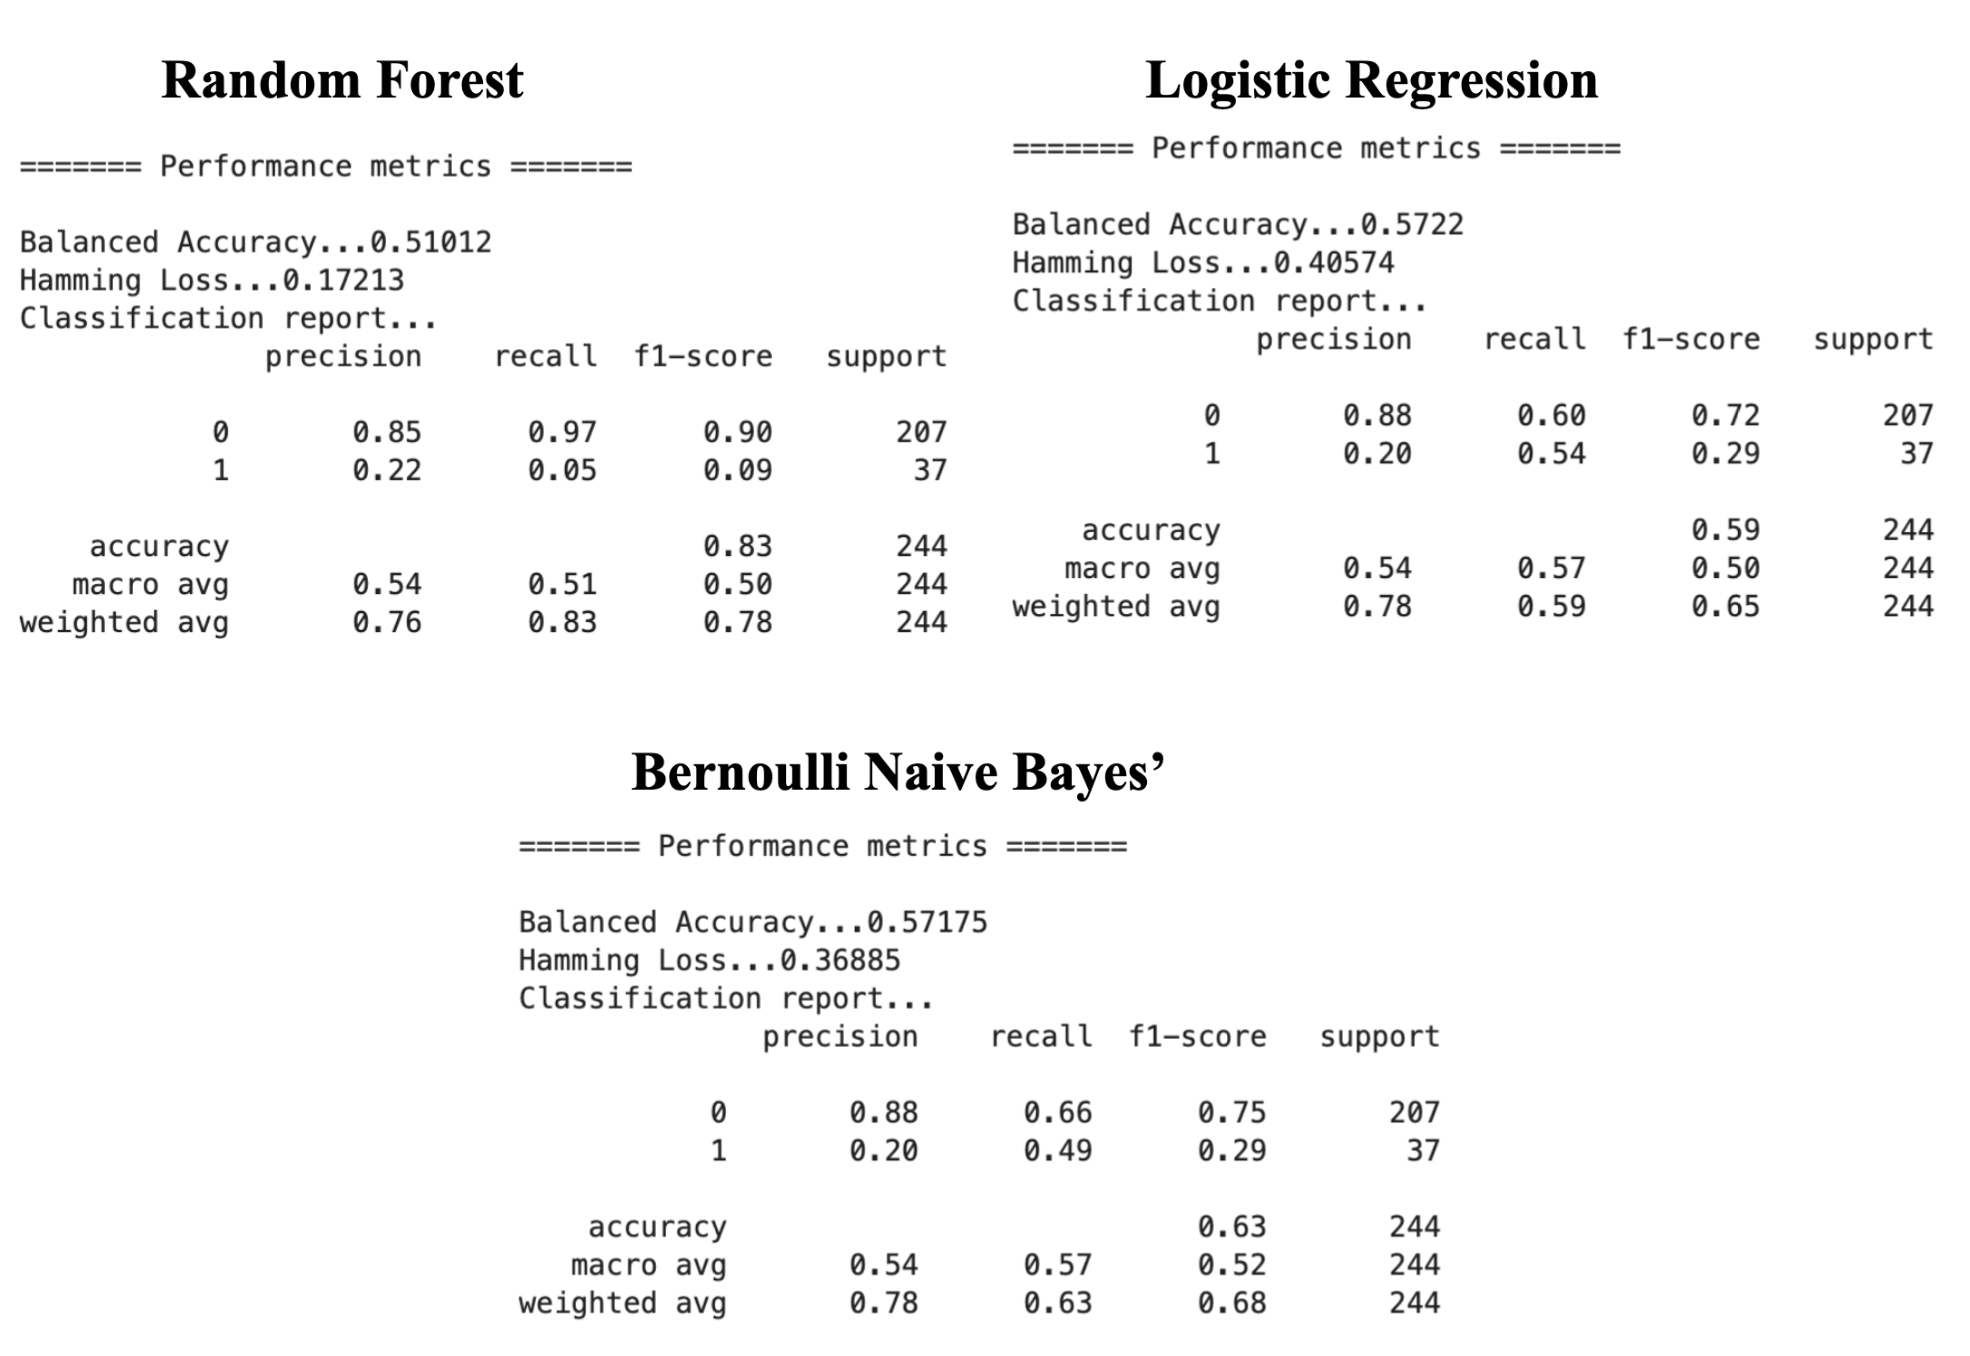
Figure 2: Performance metric reports for each of the algorithms. Metrics are reported across all patients and within each class. “0” = correctly triaged, “1” = mistriaged.
Key Feature Predictors:
L1 Regularized (LASSO):
The L1 Regularized (Least Absolute Shrinkage and Selection Operator [LASSO]) Logistic Regression coefficients provided clear evidence of feature causality, showing strong positive influence on the probability of mistriage. The top five positive coefficients from L1 Regularized LR include the categorical features: DG_neurological (+1.029), DG_musculoskeletal_trauma (+0.502), DG_other_systemic (+0.450), CC_systemic_infectious (+0.300), and DG_infectious (+0.295), suggesting they are strong predictors of mistriage probability in a linear model. This model struggled to use continuous vital signs, which generally had coefficients close to zero.
SHAP Analysis:
SHapley Additive exPlanations (SHAP) is an approach used to explain the output of a machine learning model by interpreting which features are most important to the final model’s predictions and how they influence the outcome. Positive SHAP values (red) indicate an increased contribution toward the prediction of mistriage, while negative SHAP values (blue) indicate a contribution toward the prediction of correct triage.
The most influential features include HR, Length of stay_min, Age, BT, SBP, DBP, and RR (Figure 3). These variables demonstrate a wide spread of SHAP values, indicating a strong influence on the model’s predictions. However, the colour gradients for these features are not clearly defined, suggesting that their effects on mistriage risk are non-linear and context-dependent rather than driven by simple threshold effects. Overall, these findings suggest that abnormal or extreme vitals (e.g., high HR, abnormal BP, abnormal RR) increase the model’s likelihood of predicting mistriage. Similarly, longer Length of stay_min values are strongly associated with mistriage, likely reflecting the downstream clinical reassessment and correction of initial nurse triage decisions rather than a direct causal relationship since this information would not be available at the time of triage.
The KTAS nurse-assigned triage level (KTAS_RN) features are also highly informative, with KTAS_RN_3 emerging as one of the strongest contributors to mistriage prediction. Assignment to KTAS level 3 markedly increases the probability of mistriage, which is consistent with its role as a borderline acuity category where both under-triage and over-triage are most likely to occur. In contrast, other KTAS levels show smaller and more directional effects.
Chief complaint and emergency department diagnosis variables (prefixed CC_ and DG_, respectively) exhibit comparatively smaller SHAP magnitudes and asymmetric effects. This suggests that these categorical features act as secondary modifiers of risk rather than primary drivers of mistriage, refining predictions within the broader context established by vital signs, patient age, and triage level.
These two feature importance analyses yielded contrasting findings based on model type. The linear LR model identified clinical categorical features (e.g., DG_neurological, DG_musculoskeletal_trauma, CC_systemic_infectious) as the primary drivers of mistriage probability. In contrast, the subsequent non-linear RF analysis (SHAP) was dominated by seemingly less-clinical, noisy continuous variables (HR, Length of stay_min, DBP), suggesting that the RF struggled to leverage the strong categorical signals. This contrast highlights the challenge in balancing the influence of continuous variables (which often carry noise) and specific clinical categories in predicting the minority class.
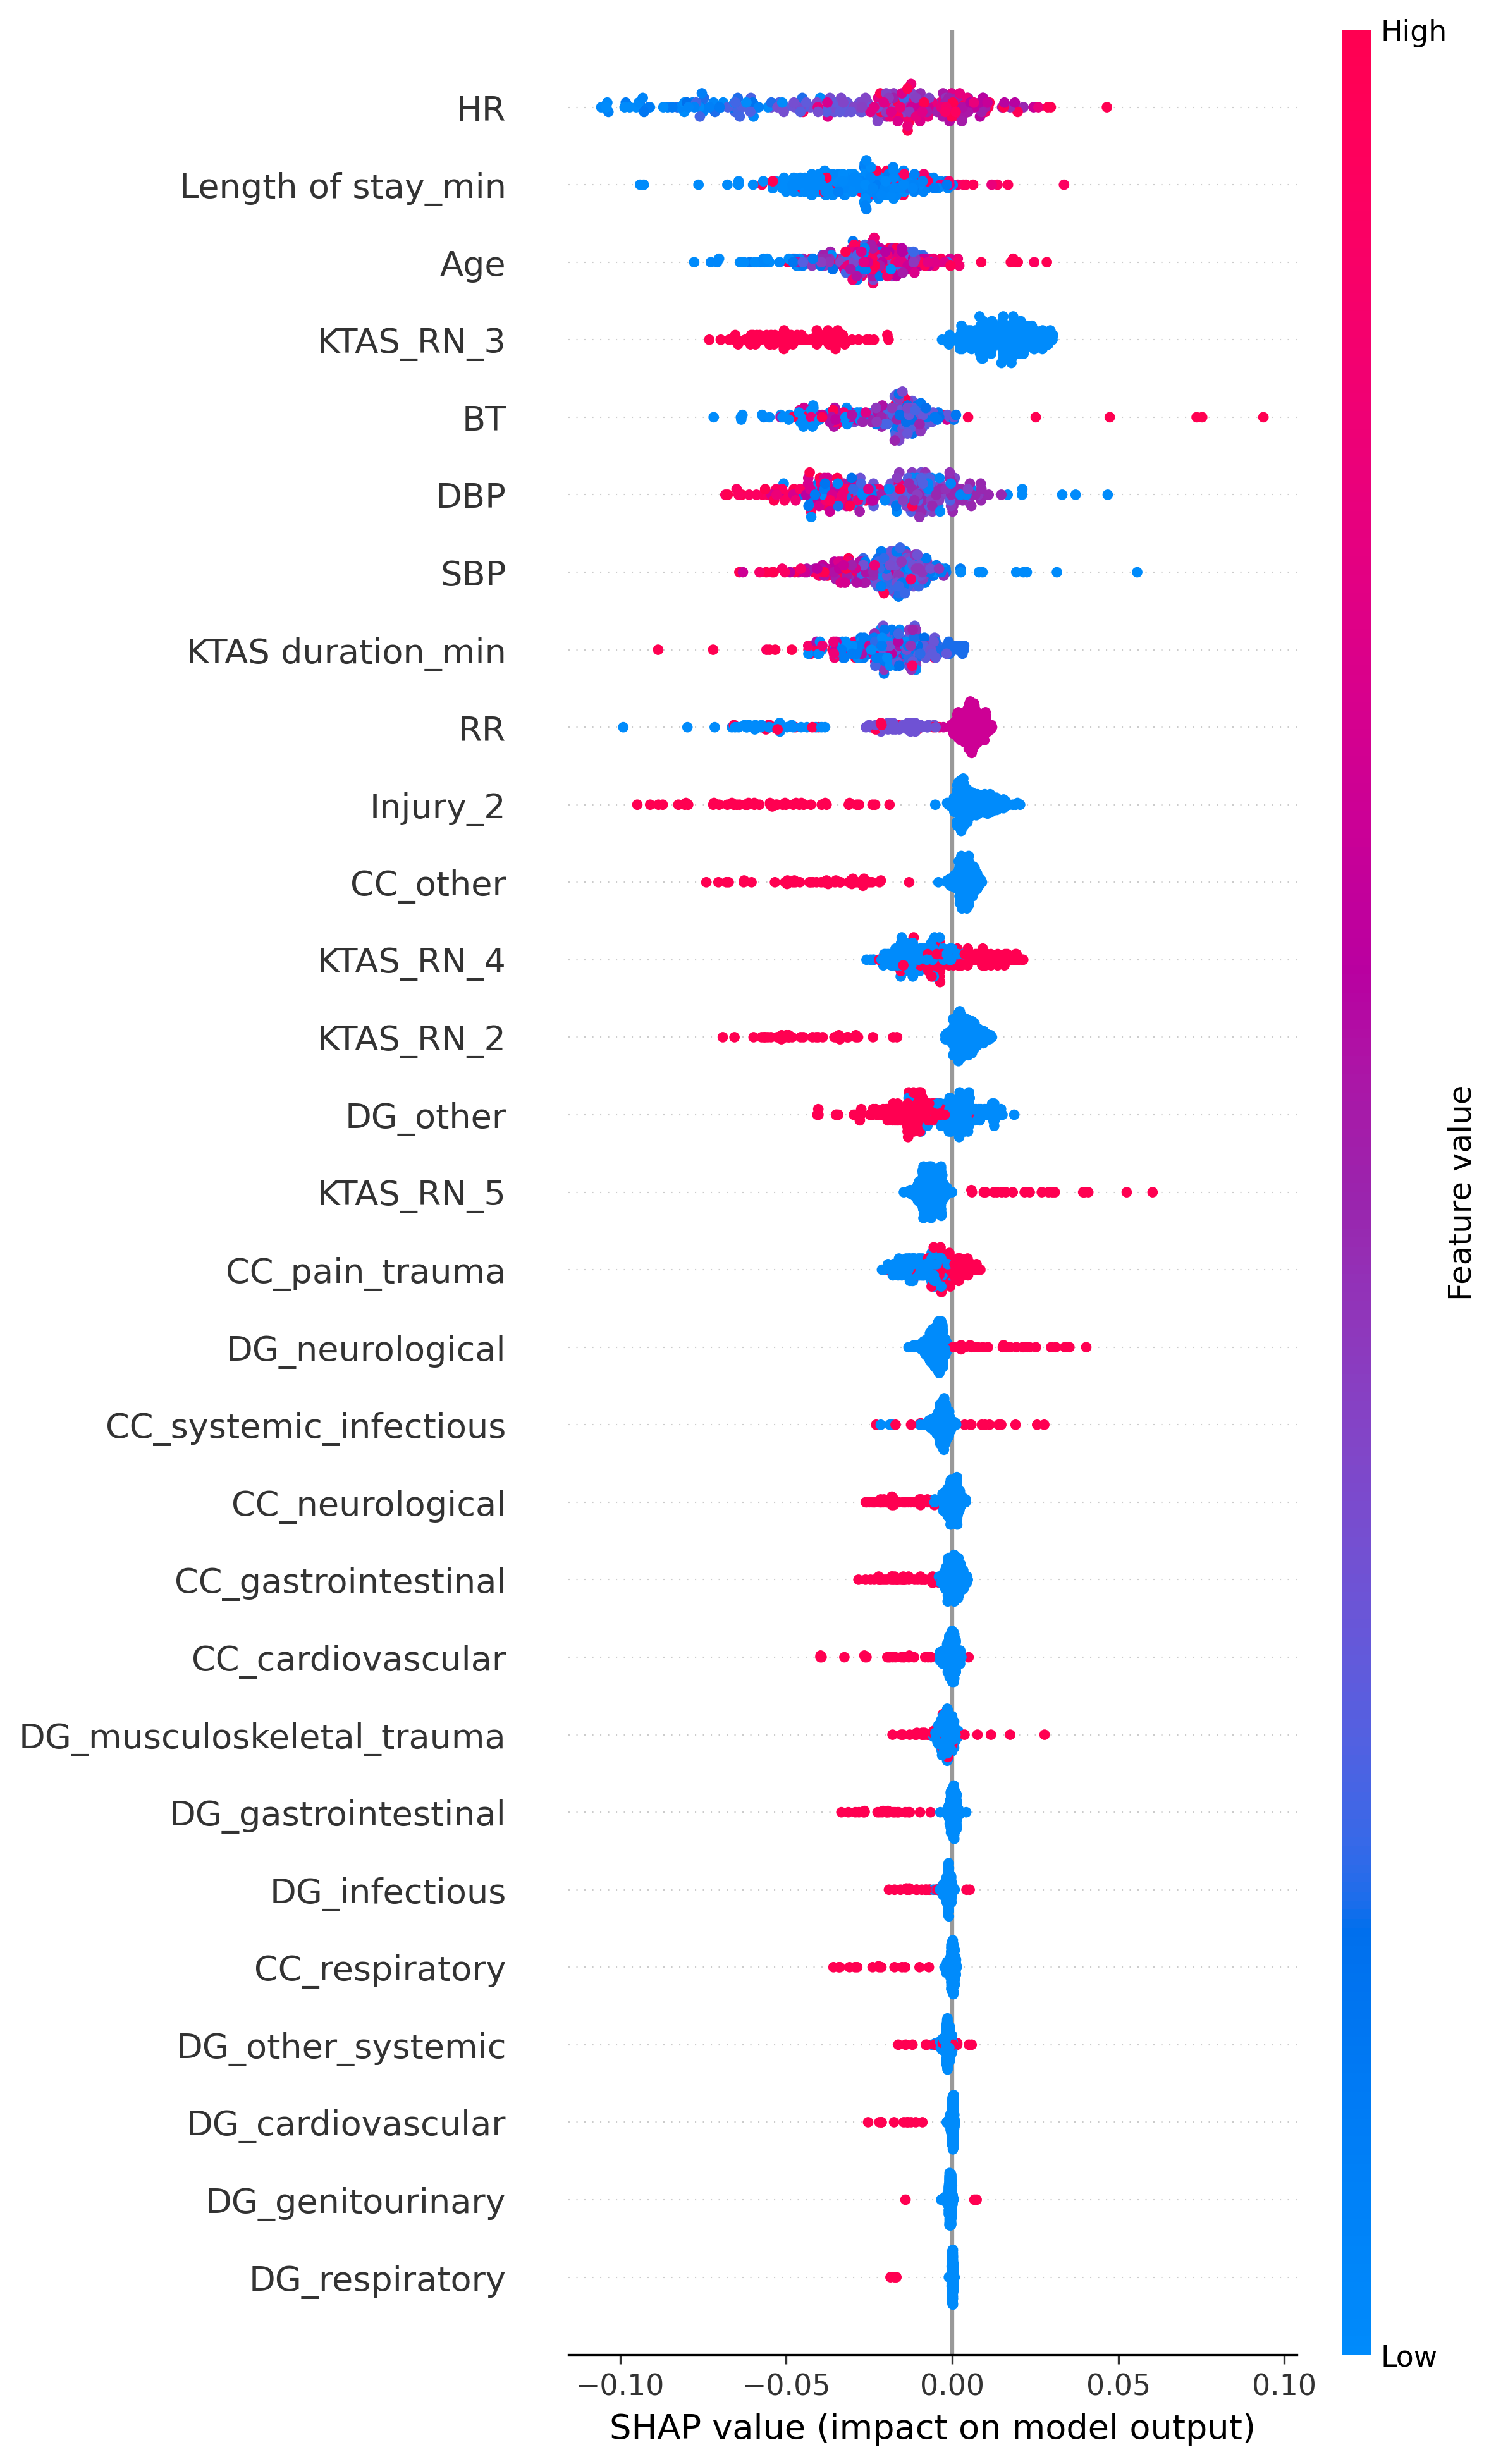
Figure 3: SHAP plot showing the overall feature importance and directional impact on the mistriage prediction.
Unsupervised Learning Findings:
In order to identify hidden patterns and the healthcare data’s inherent separability, unsupervised learning was implemented through t-SNE clustering and K-means. The t-SNE plot shows distinct clusters of data points, which suggests that the underlying patient data does contain natural groupings or structures based on the input features. However, the colours of the dots (representing the mistriage class) are scattered within the clusters. This indicates that while the features group the patients effectively, these specific groupings do not perfectly correlate with the mistriage outcome.
However, the K-means Purity Score contradicted the t-SNE visualization, yielding a high value of 0.8569. This score suggests that if a simple boundary were drawn around the dense patient groups, 85.69% of the records would fall into the cluster that represents their true outcome (Correct or Mistriage). This disconnect is likely due to two factors. The first factor is that the data is highly imbalanced, with mistriage being the small minority. In t-SNE, the small minority class (mistriage) often gets scattered amongst the vast majority class (correctly triaged) because the density of the majority class overwhelms the visualization. Even if 85% of the points are separated, the scattered 15% can make the whole plot look mixed. The second factor is that the K-means algorithm to calculate the purity score is finding the two main centers of density. It is classifying a huge number of patients correctly, even if the boundary is unclear in the plot and despite the scattered minority points. Overall, the high purity score suggests that the data contains dominant structural patterns driven largely by the majority class, rather than strong discriminative structure specific to mistriage.
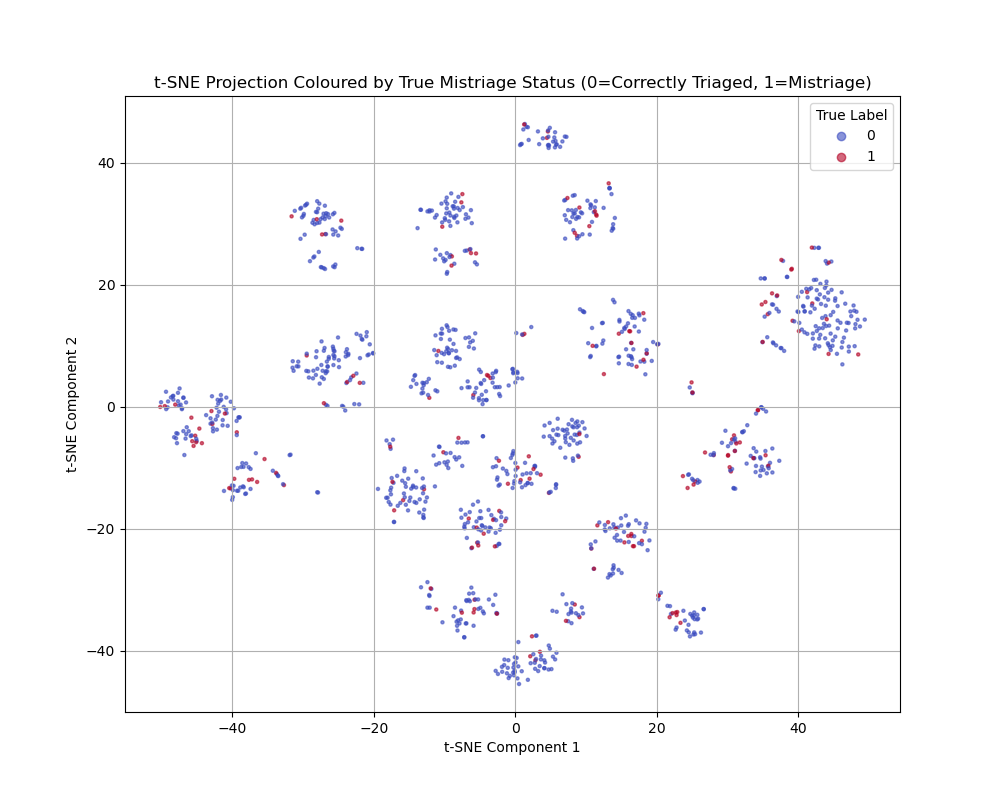
Figure 4: t-SNE showing the non-linear separation of the Correctly Triaged and Mistriaged classes.
Discussion and Conclusion
The goal of developing a reliable, predictive model for mistriage was not fully achieved by any supervised learning model. The project’s most significant finding is the disconnect between the potential information quality, as indicated by the high Purity Score of 0.8569, and the achieved supervised predictive power, which peaked at an ROC-AUC of 0.6766. The inherent structure of the data makes the outcome of mistriage difficult to predict reliably using only the available features.
The models suffered from a combination of two factors. The first factor is a low signal-to-noise ratio. Feature importance analysis showed that noisy, weakly correlated features (Length of stay_min, DBP, RR) often dominated the decision-making process in the initial Random Forest model, masking the signal from the strong DG_ categories. The second factor is the highly imbalanced data and the resulting collapse of recall scores. Even with advanced balancing techniques like SMOTE, the models consistently reverted to predicting the majority class (Correctly Triaged), leading to disastrous Recall (≤0.05 on the most capable model before pruning).
The key takeaway is that the event of mistriage, within this dataset, is likely determined by complex, subtle factors that are not captured by standard vitals, demographics, or simplified CC_/DG_ categories. These critical missing factors could include triage nurse experience/ or workload, time of day, day of week, or detailed severity scores beyond simple pain scores. The high coefficient of DG_neurological (+1.029) provides a strong hypothesis: patients whose initial presentation quickly leads to a high-acuity, complex diagnosis are more prone to initial misjudgment. This is likely due to the subtle severity that was missed during the triage process.
Conclusion:
In conclusion, this project demonstrates that reliably predicting emergency department mistriage using standard triage-time variables remains a substantial challenge. Although unsupervised analysis revealed dominant structural patterns within the data, supervised models consistently failed to translate this structure into clinically meaningful minority-class performance. The persistent collapse of recall for mistriage cases, even after applying advanced imbalance-handling techniques, highlights a fundamental mismatch between the available feature set and the complex, context-dependent nature of triage decision-making. These findings suggest that mistriage is influenced by subtle clinical and operational factors not captured in routine vital signs, demographic data, or simplified chief complaint and diagnosis categories. Future efforts should therefore prioritize the collection of higher-resolution clinical and system-level data, such as detailed severity assessments, triage nurse workload, and temporal context, to uncover the latent signals necessary for reliable and clinically actionable mistriage prediction.
References
Guttmann, A., Schull, M. J., Vermeulen, M. J., & Stukel, T. A. (2011). Association between waiting times and short term mortality and hospital admission after departure from Emergency Department: Population Based Cohort Study from Ontario, Canada. BMJ, 342(jun01 1), d2983–d2983. https://doi.org/10.1136/bmj.d2983