
Toronto Ambulance, where do you need us?
Published:
A comprehensive data visualization project analyzing Toronto Paramedic Services (TPS) dispatches from 2010-2016 in Python and Tableau, with insights into response patterns relative to the city’s population distribution, call volume, and incident patterns.
Introduction
Emergency Medical Services (EMS) are a crucial part of urban infrastructure, ensuring that critical care reaches those in need as fast as possible. In this analysis, I explore Toronto Paramedic Services (TPS) dispatch data to understand where ambulances are most frequently deployed, and whether patterns emerge based on location and time.
Using Python and geospatial visualization techniques, I dive into the data to uncover trends that could help optimize emergency response strategies. The dataset consists of ambulance dispatch records, each containing details such as general location, timestamp, and dispatch priority. The goal is to map these locations and examine patterns across different time periods.
In order to reduce local computational load and limit data size for GitHub storage, the data was subset to include only the year 2010. Visit the GitHub page to explore the code.
For an immersive look at Paramedic Incident data from 2010-2016 inclusive, visit the Tableau dashboard to explore it yourself.
Data Exploration
Paramedic Incident data obtained from the City of Toronto’s Open Data site.
The dataset consists of ambulance dispatch records, each containing details such as general location, timestamp, and dispatch priority. The goal is to map these locations and examine patterns across different time periods.
To begin, the dispatch incident data was loaded and subsetted for dates within the year 2010. Missing values and NaNs were identified and handled appropriately to ensure data integrity. Similarly, population data was loaded and refined by renaming columns to align with the dispatch dataset, facilitating an accurate merge of relevant postal codes. After these preprocessing steps, the datasets were transformed and exported into parquet and CSV formats for further analysis.
Additionally, an exploratory analysis was conducted to examine the structure of the datasets, including column attributes, dataframe shapes, and data types. This foundational work set the stage for in-depth visualizations and insights.
Data Visualization & Summary Statistics:
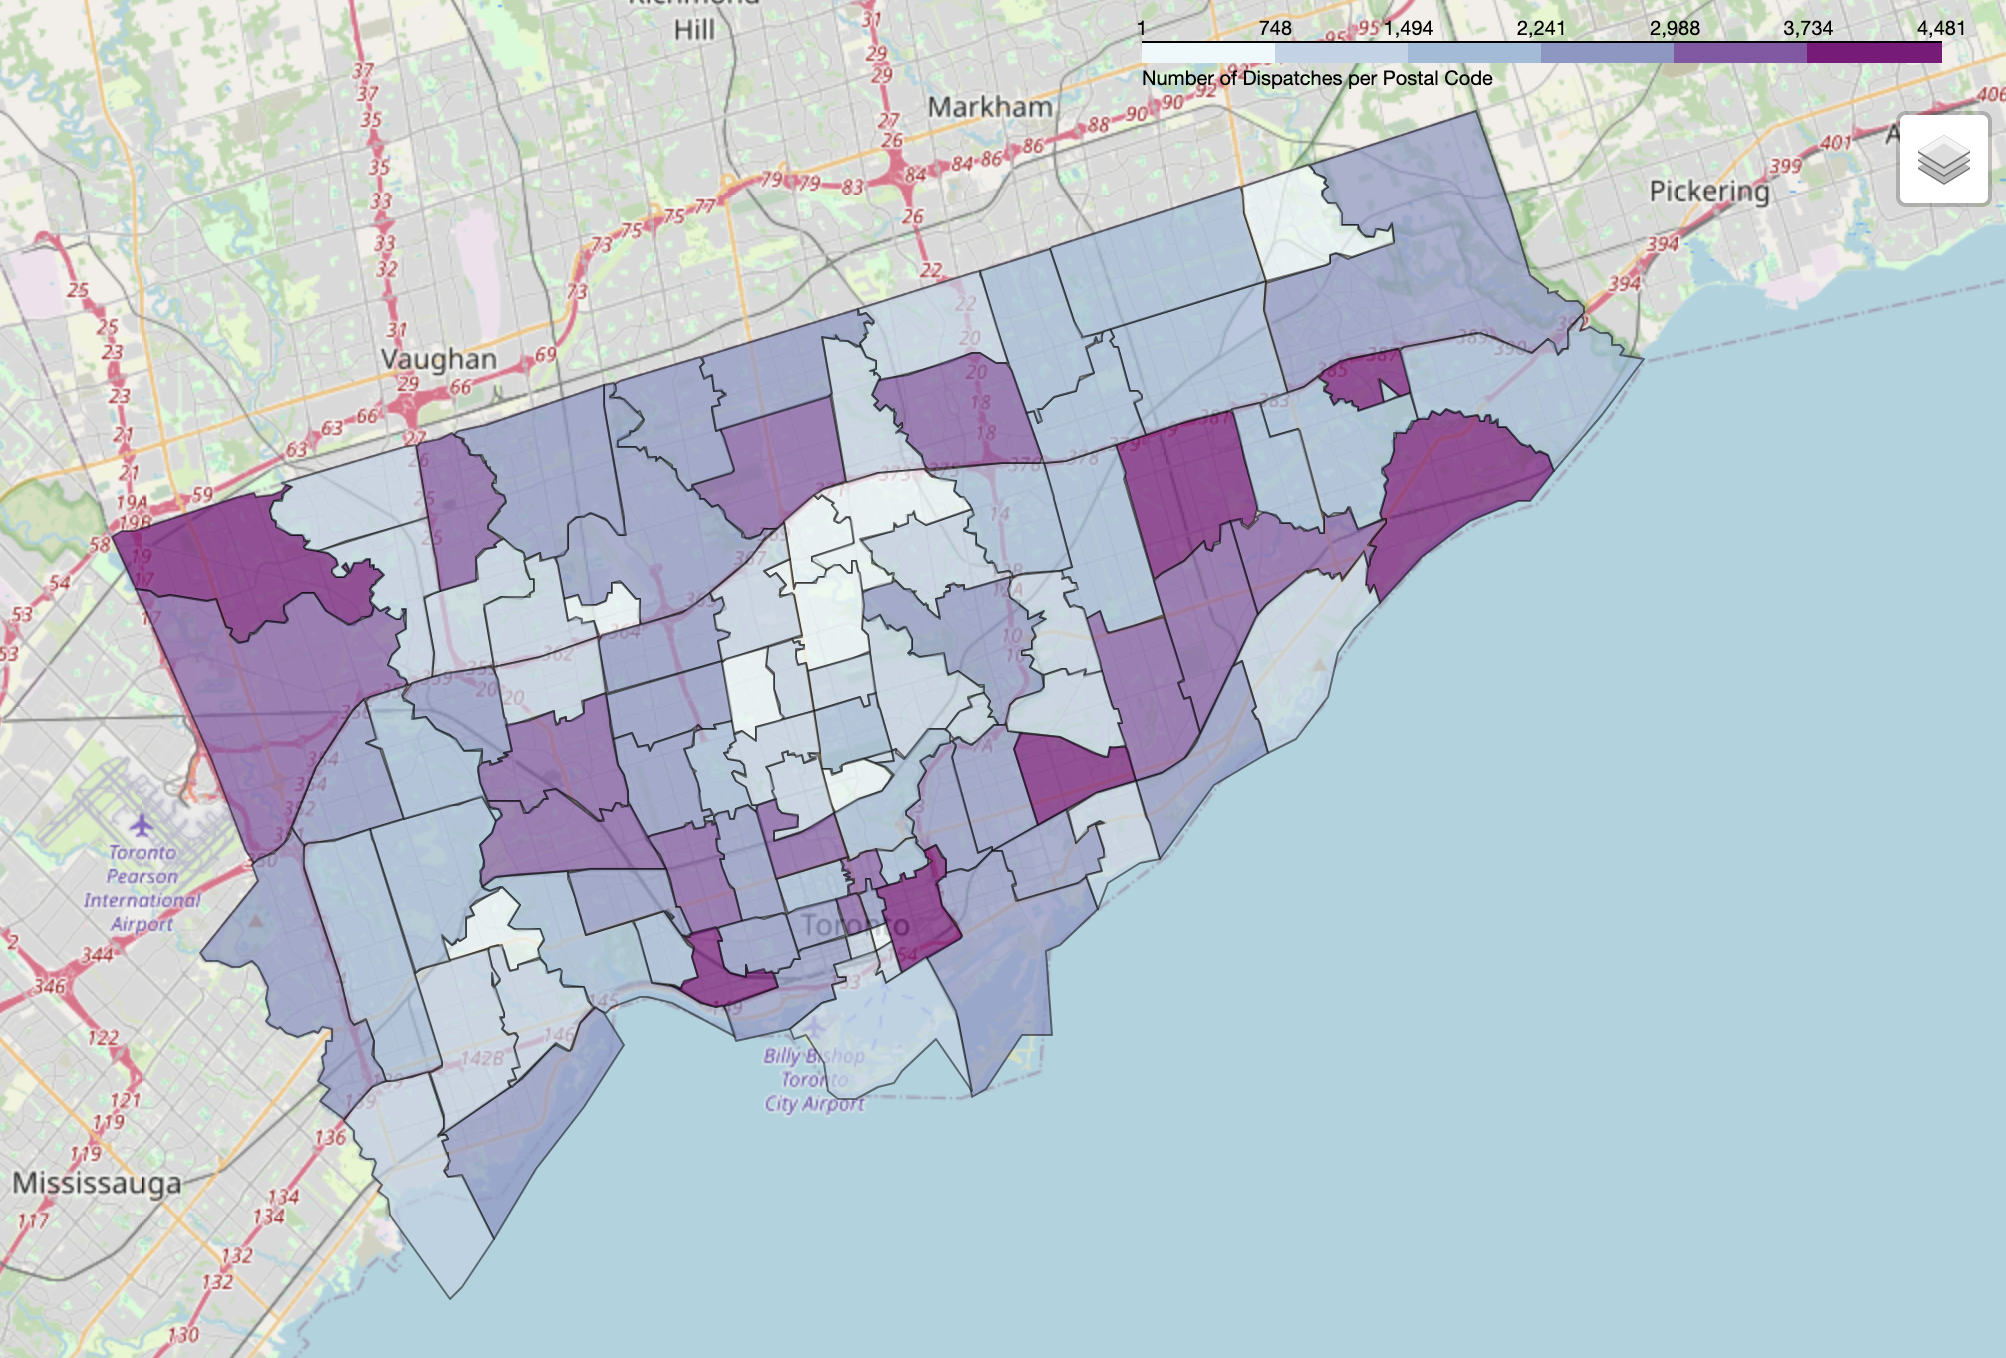
Using Folium, I created choropleth maps to visualize the density of ambulance dispatches across Toronto’s Forward Sortation Areas (FSA - a geographical area that is defined by the first three characters of a postal code). These maps highlight areas with consistently high emergency call volumes.
Dispatches per Postal Code:
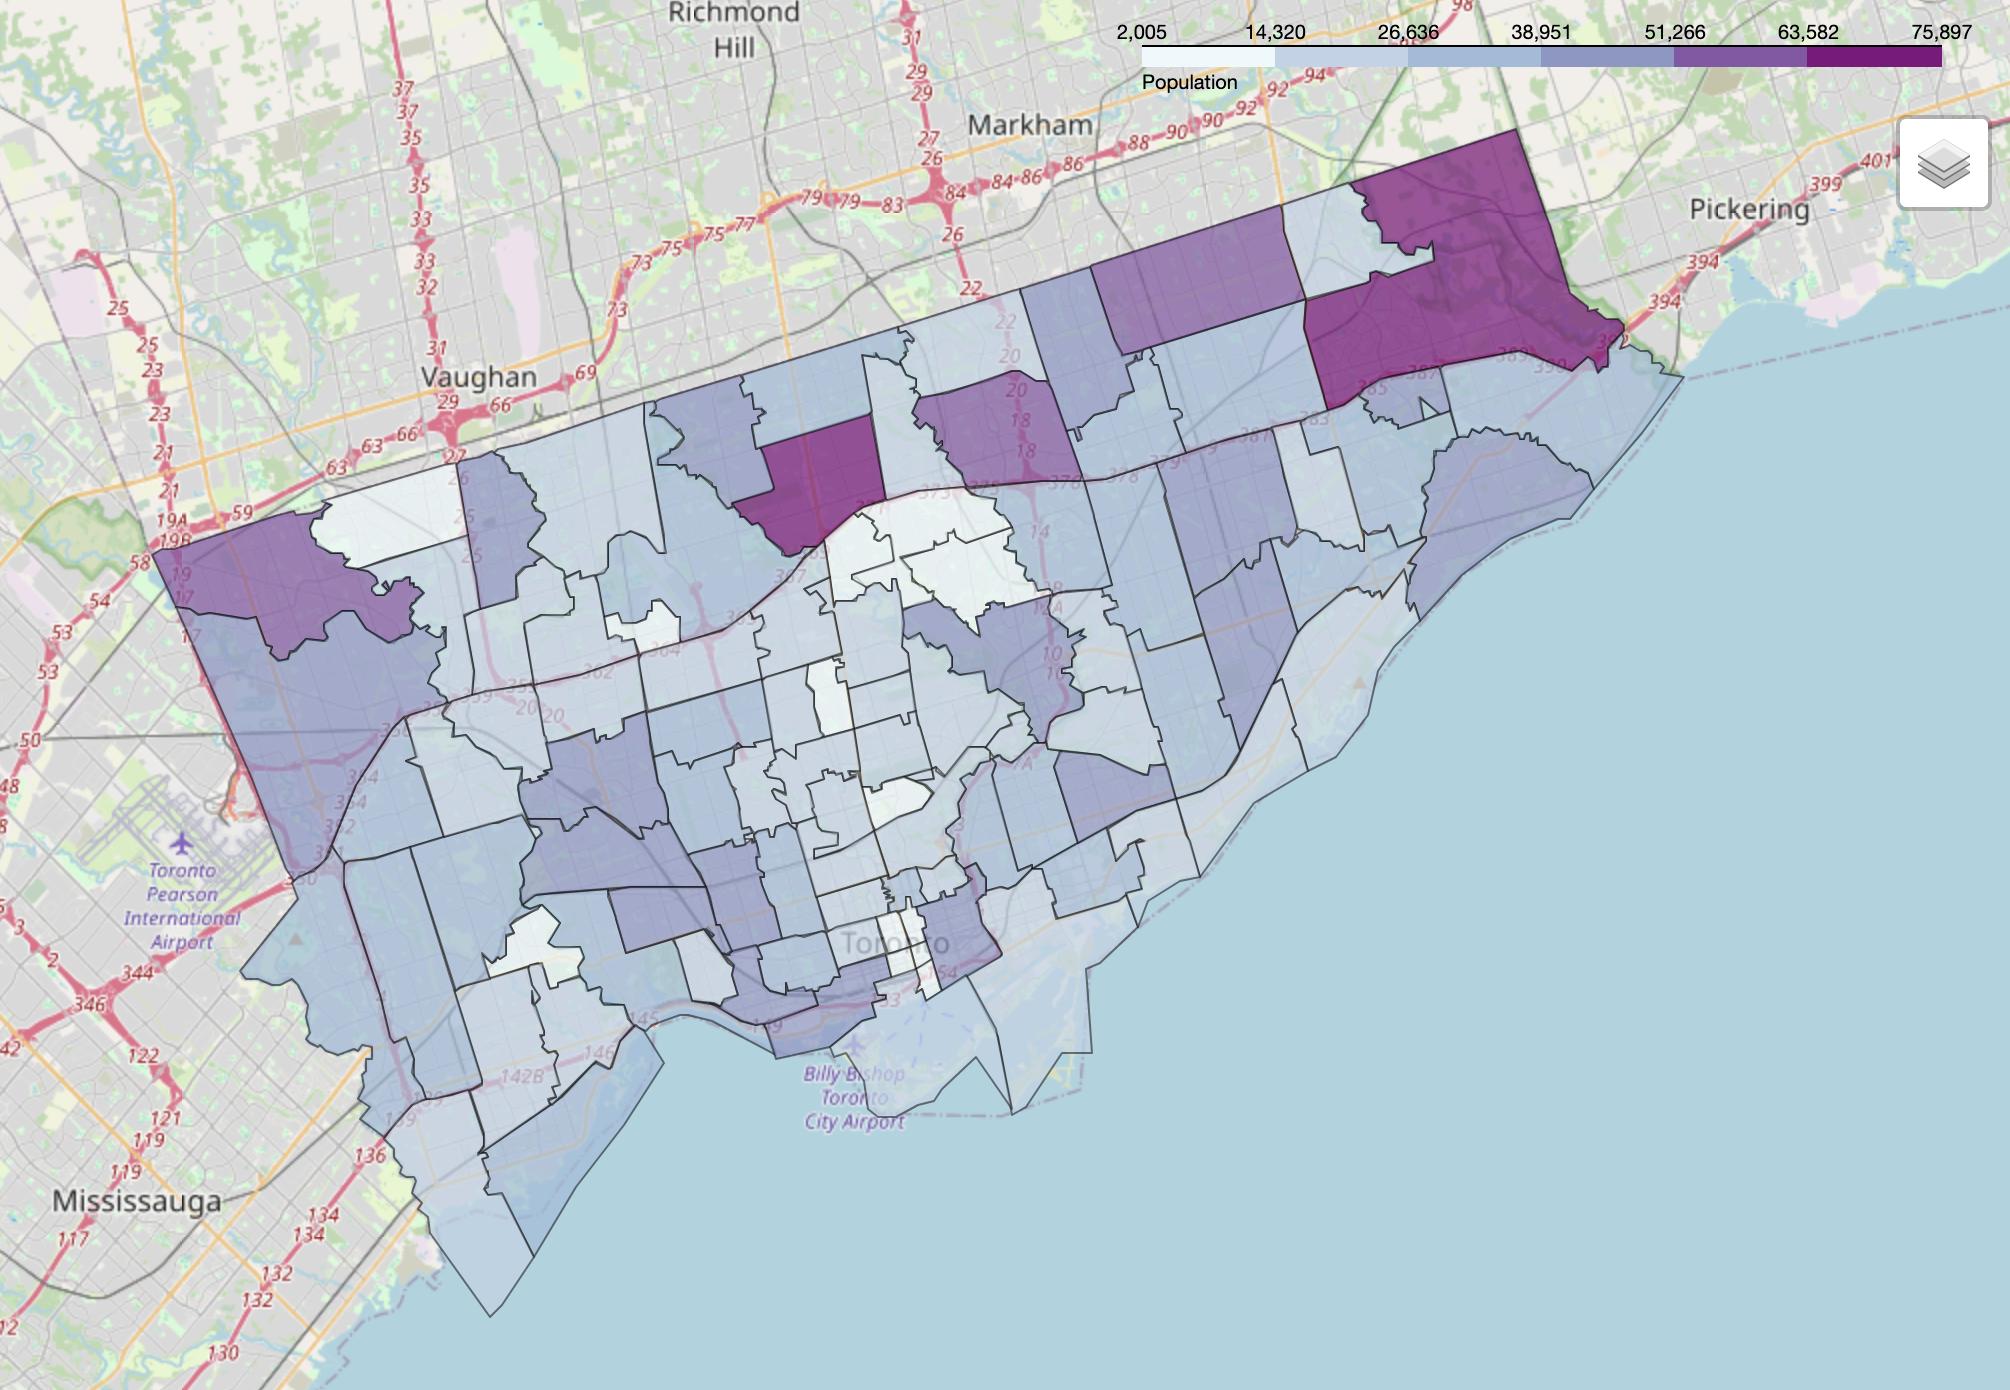
Toronto Population:
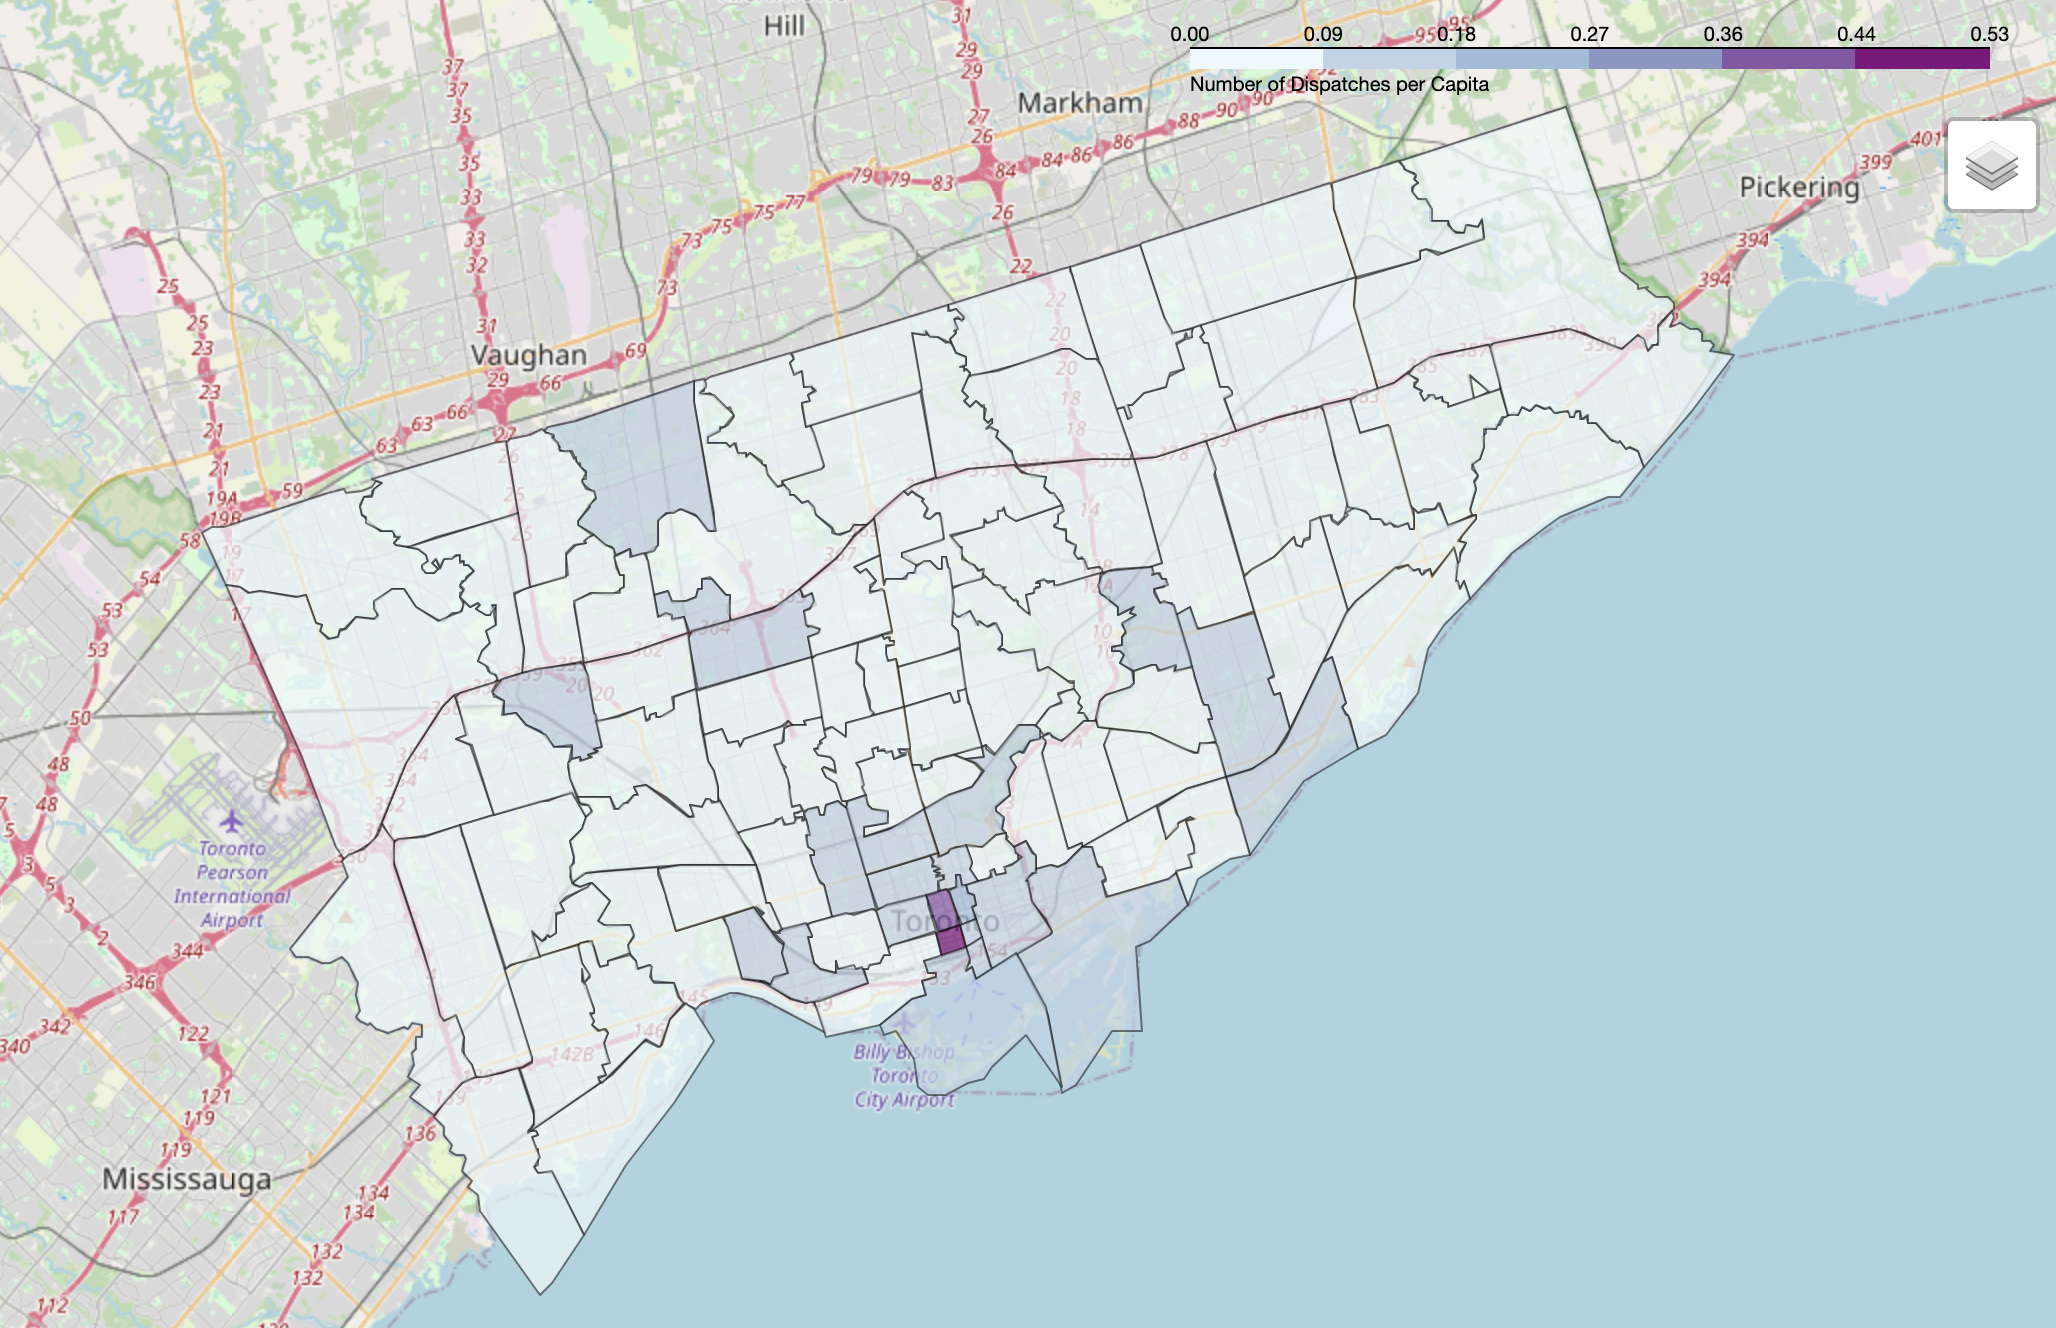
Dispatches per Capita:
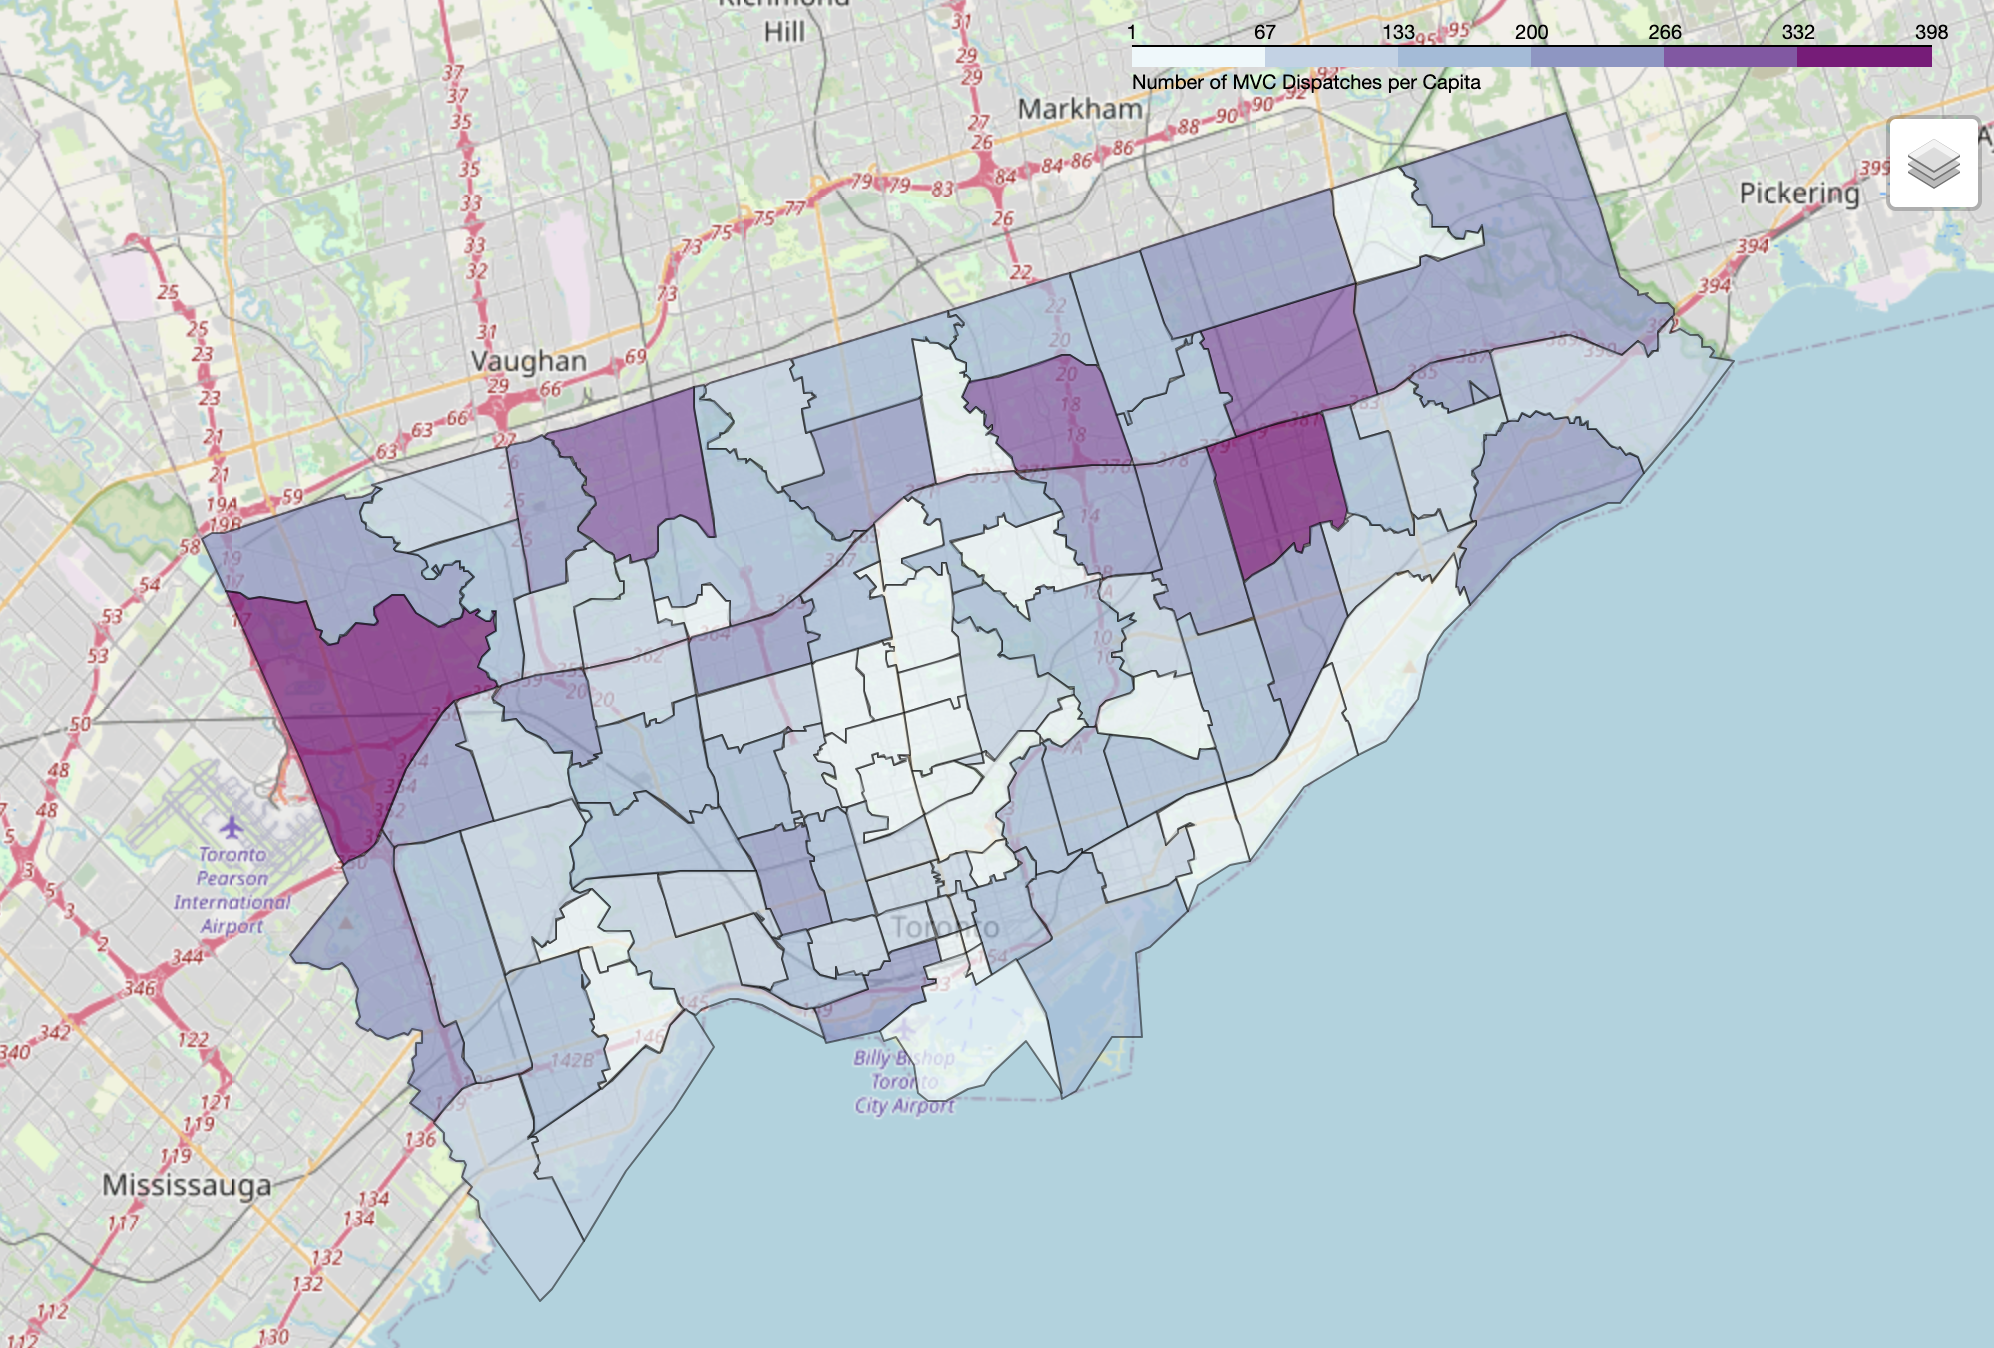
Motor Vehicle Collisions per Capita:
Statistics - 2010:
- The total number of dispatches was
204805. - The highest dispatch volume day of the year was
Monday, July 5th, 2010, with727dispatches. - The highest dispatch volume by FSA was
4481dispatches in the FSAM6K. - The average time between dispatches was
153.98 seconds, or2.57 minutes. - The highest dispatch volume month was
Julywith19399dispatches total.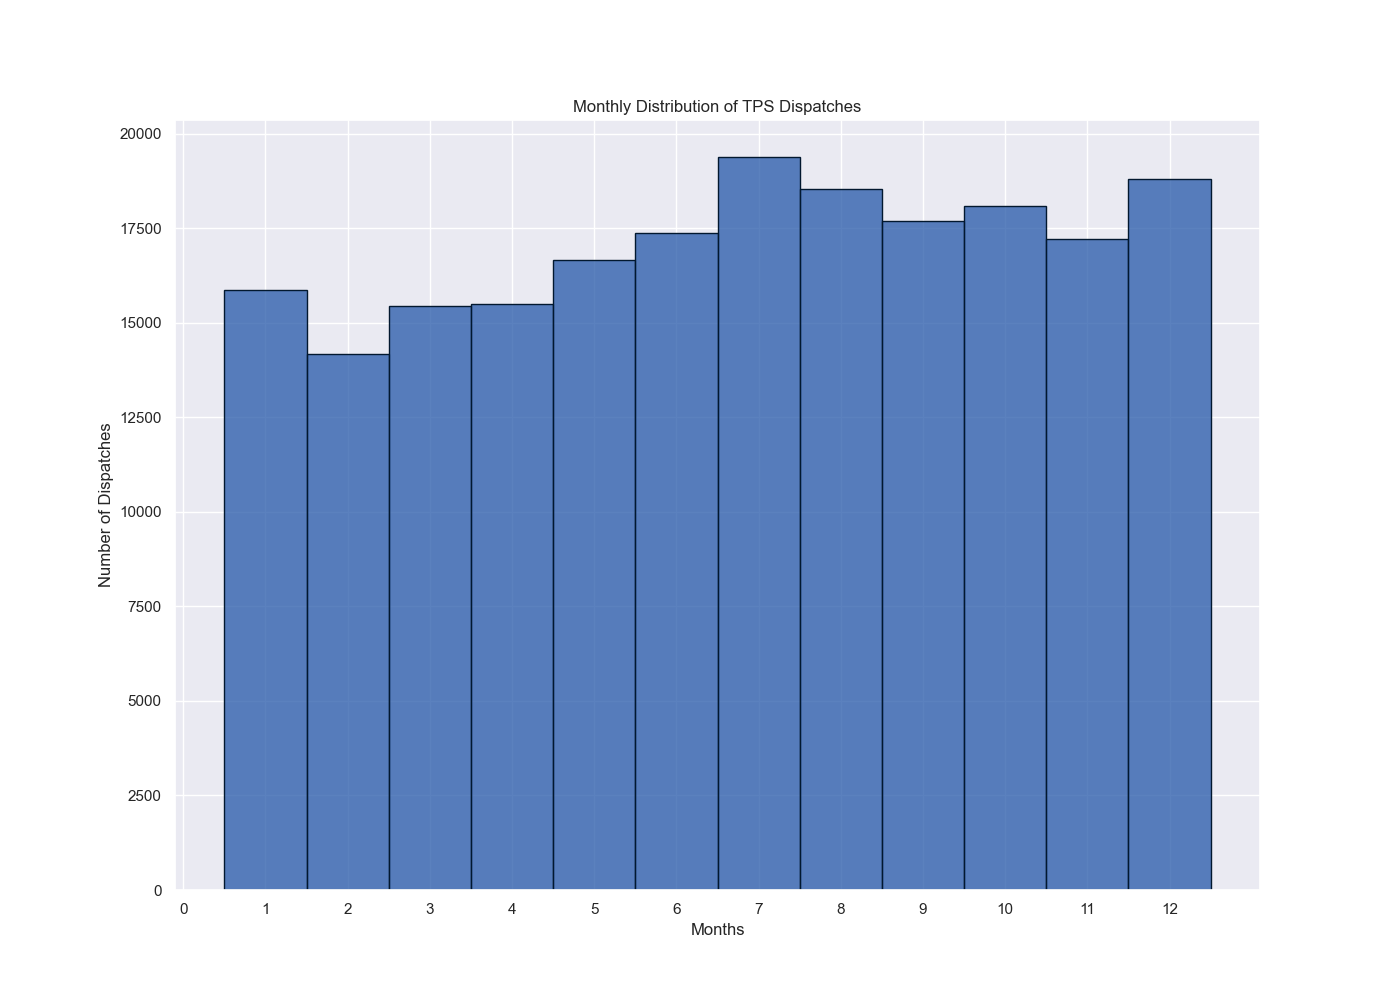
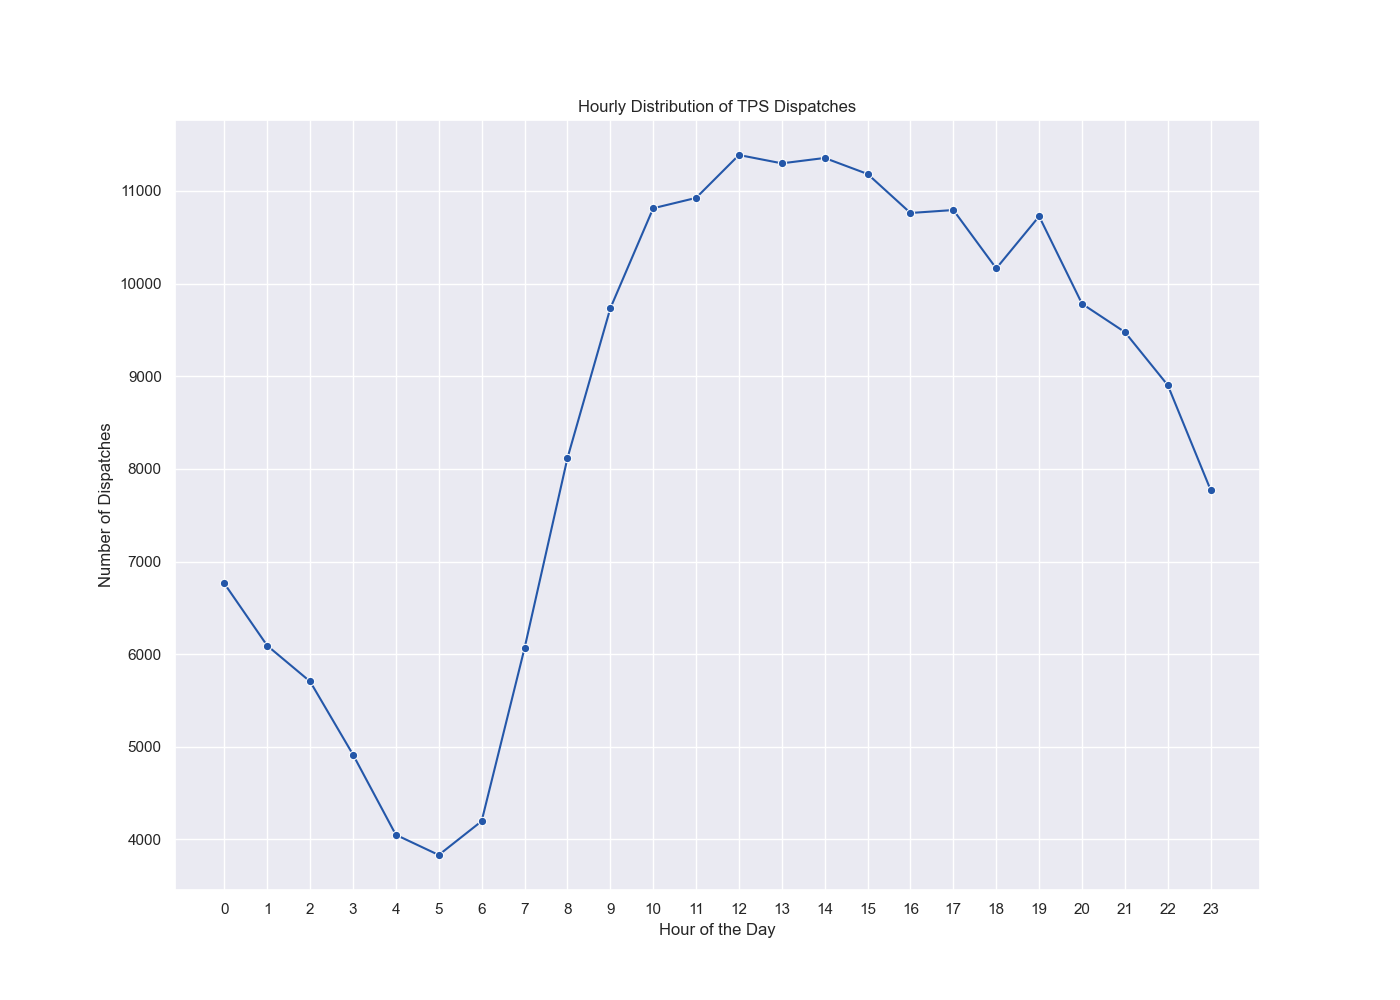
- The highest hourly dispatch volume was
12:00PM, with the lowest at5:00AM.
- Dispatch volume by Incident Type:
Incident_Type Airport Standby 34 Emergency Transfer 3743 Fire 1094 Medical 186600 Motor Vehicle Accident 13334 - The most common dispatches by Priority was
Deltawith70751incidents: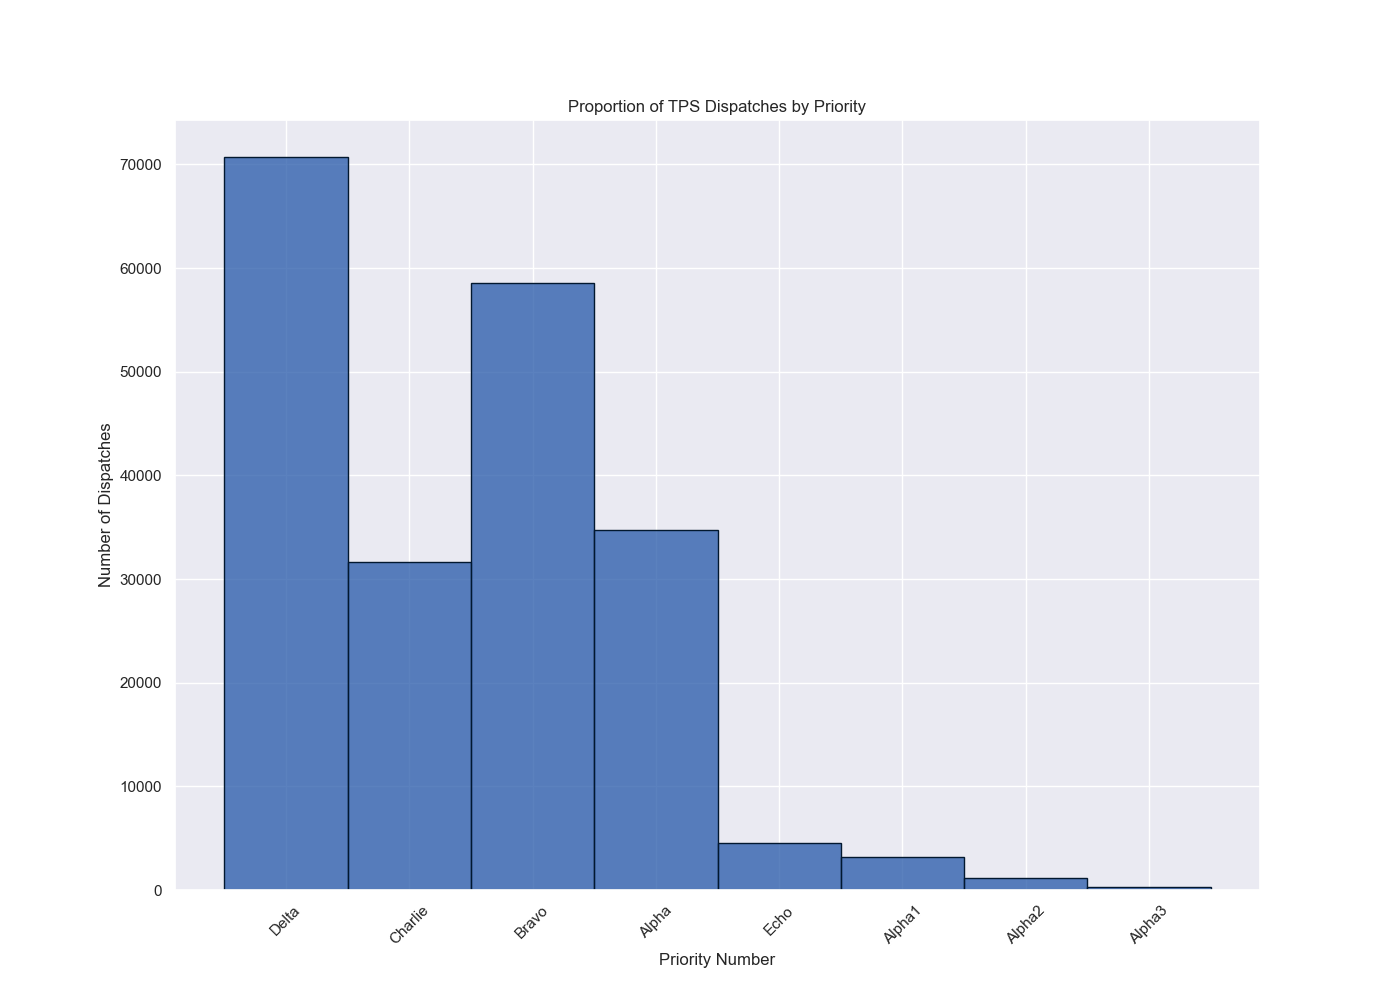
  Priority_Name    Priority_Number
  Delta            1                 70751
  Charlie          4                 58526
  Bravo            5                 34691
  Alpha            3                 31629
  Echo             9                  4567
  Alpha1           11                 3190
  Alpha2           12                 1179
  Alpha3           13                  272
Key Insights & Investigational Findings
This analysis uncovers several important insights into Toronto’s emergency medical service demands:
- High-Demand Areas: Certain FSAs consistently demonstrate high dispatch volumes, indicating “hotspots” for EMS demand. These areas should be prioritized for resource allocation, such as increasing ambulance availability or deploying community paramedicine initiatives to help reduce call volume.
- Peak Hours of Demand: Dispatch frequency increases during specific times of the day, notably around
12:00 PM, likely aligning with work and commute hours. This suggests a need for EMS to be particularly responsive during mid-day hours when demand is highest. - Seasonal Trends: Higher call volumes in the summer months, particularly
July, could be indicative of environmental factors such as warm weather, increased outdoor activity, or tourism-related incidents. Understanding these seasonal patterns can help plan for more efficient seasonal staffing. - Priority Levels: The dataset highlights that the majority of EMS calls are classified under the
DeltaPriority, followed byBravoandAlpha. This information could inform the type of training or resources required by paramedics for in-field assessments. - Time Between Dispatches: The average dispatch interval of
2.57 minutessuggests relatively high call volumes. To keep up with this demand, there is a need for more paramedics, dispatchers, and resources to ensure timely response times and avoid system strain.
Conclusion
This analysis provides a deeper understanding of Toronto’s EMS landscape, offering actionable insights for improving paramedic services and optimizing resource allocation. The patterns identified in terms of location, time, and incident types can help to inform strategies for better response times, more effective deployment, and improved community health outcomes.
Next Steps
This investigation highlights the need for further data analysis on more robust datasets to garner insights into operational bottlenecks.
- Expand the Analysis: Extend the investigation to include more recent years of data, allowing for the identification of emerging trends and patterns over time.
- Investigate Response Times & Patient Outcomes: Analyze response times and correlate them with patient outcomes to assess the effectiveness of paramedic interventions.
- Impact of Special Events: Examine the influence of major city events (e.g., concerts, festivals, protests) on EMS demand to ensure adequate resource allocation during high-impact times.
- Invest in Community Paramedicine: For FSAs that receive a high volume of lower-acuity calls, consider expanding community paramedicine programs. These programs can address non-emergency healthcare needs, reduce hospital strain, and free up resources for more critical emergencies.
- Improve Staffing Based on Time-of-Day and Seasonal Trends: Adjust staffing models to better reflect periods of high demand, such as mid-day and summer months. Consider deploying additional resources in areas with consistently high dispatch rates.