Toronto Ambulance, where do you need us? - Python
Published:
A data visualization of Toronto Paramedic Services dispatches from 2010, compared to Toronto population size.
Section 1
1.0 Installing and importing dependencies
# !{sys.executable} -m pip install requests
# !{sys.executable} -m pip install pandas
# !{sys.executable} -m pip install xlrd
# !{sys.executable} -m pip install openpyxl
# !{sys.executable} -m pip install matplotlib
# !{sys.executable} -m pip install folium

import sys
import pandas as pd
import requests
import matplotlib.pyplot as plt
import folium
import re
2.0 Loading and cleaning Toronto Paramedic data
# Read the dispatch dataset in with time-indexing
dispatches = pd.read_excel(r'/Users/erincameron/Desktop/datacamp/github/datacamp/datasets/tps_incident_data_2010-2019.xlsx', parse_dates=True, index_col="Dispatch_Time")

dispatches.sort_index()
dispatches.head()
3.0 Subsetting data
# subset for only 2010 Dispatch_Times
dispatches_df = dispatches.loc["2010-01-01 00:01:36":"2010-12-31 23:57:27"]

# remove any missing data points
dispatches_df.isna()
dispatches_df.fillna(value=0, inplace=True)
dispatches_df.dropna()

# subset the data for the most recent year of calls (in 2019)
call_counts = dispatches_df.FSA.value_counts().rename_axis('FSA').reset_index(name='counts')
print(call_counts)

         FSA  counts
    0    M6K    4481
    1    M5A    4202
    2    M4C    3846
    3    M1E    3809
    4    M1P    3802
    ..   ...     ...
    150  N2G       1
    151  N4S       1
    152  L2P       1
    153  L5C       1
    154  L6R       1

    [155 rows x 2 columns]

# check if there are any missing values
print(call_counts["FSA"].isnull().sum())
    0
Section 2
1.0 Loading and cleaning Toronto Population dataset
population = pd.read_excel(r'/Users/erincameron/Desktop/datacamp/github/datacamp/datasets/canada_population_by_postal.xlsx')
population.sort_index()
population.head()

rename_pop_column = to_population.rename(columns = {'Geographic code': 'FSA'}, inplace = False)
# print(rename_pop_column.head())

call_counts = pd.merge(call_counts, rename_pop_column, on="FSA")
call_counts = call_counts.rename(columns = {'Population, 2016': 'population'}, inplace = False)
call_counts["call_per_capita"] = call_counts["counts"] / call_counts["population"]
print(call_counts.head())
       FSA  counts Geographic name Province or territory  \
    0  M6K    4481             M6K               Ontario
    1  M5A    4202             M5A               Ontario
    2  M4C    3846             M4C               Ontario
    3  M1E    3809             M1E               Ontario
    4  M1P    3802             M1P               Ontario

       Incompletely enumerated Indian reserves and Indian settlements, 2016  \
    0                                                NaN
    1                                                NaN
    2                                                NaN
    3                                                NaN
    4                                                NaN

       population  Total private dwellings, 2016  \
    0     40957.0                        23344.0
    1     41078.0                        24186.0
    2     46866.0                        20178.0
    3     46943.0                        17637.0
    4     45571.0                        17129.0

       Private dwellings occupied by usual residents, 2016  call_per_capita
    0                                            22023.0           0.109407
    1                                            22333.0           0.102293
    2                                            19431.0           0.082064
    3                                            17161.0           0.081141
    4                                            16540.0           0.083430
2.0 Subsetting data
# identify the outliers
print(call_counts.sort_values("call_per_capita").tail())
         FSA  counts Geographic name Province or territory  \
    23   M5B    2901             M5B               Ontario
    15   M5G    3143             M5G               Ontario
    81   M5H    1070             M5H               Ontario
    127  L4V       5             L4V               Ontario
    103  L5T     108             L5T               Ontario

         Incompletely enumerated Indian reserves and Indian settlements, 2016  \
    23                                                 NaN
    15                                                 NaN
    81                                                 NaN
    127                                                NaN
    103                                                NaN

         population  Total private dwellings, 2016  \
    23      12785.0                         8249.0
    15       8423.0                         5876.0
    81       2005.0                         1718.0
    127         5.0                            1.0
    103         5.0                           10.0

         Private dwellings occupied by usual residents, 2016  call_per_capita
    23                                              7058.0           0.226907
    15                                              4929.0           0.373145
    81                                              1243.0           0.533666
    127                                                1.0           1.000000
    103                                                4.0          21.600000

# Subset data to remove outlier datapoints at index 127 and 103 - data that is outside of Toronto boundaries
call_counts = call_counts[(call_counts["call_per_capita"] > 0.000000) & (call_counts["call_per_capita"] <= 0.533666)]
print(call_counts.sort_values("call_per_capita").tail())
Visualizing the Data
1.0 Number of Dispatches per Postal Code
url = (
    "https://raw.githubusercontent.com/BlizzWiz/IBM_Capstone_Project/master"
)
call_geo = f"{url}/toronto_m.geojson"

m = folium.Map(location=[43.7000, -79.3832], zoom_start=10)

folium.Choropleth(
    geo_data=call_geo,
    name="choropleth",
    data=call_counts,
    columns=["FSA", "counts"],
    key_on="feature.properties.CFSAUID",
    fill_color="BuPu",
    fill_opacity=0.7,
    line_opacity=0.5,
    legend_name="Number of Dispatches per Postal Code",
).add_to(m)

folium.LayerControl().add_to(m)

m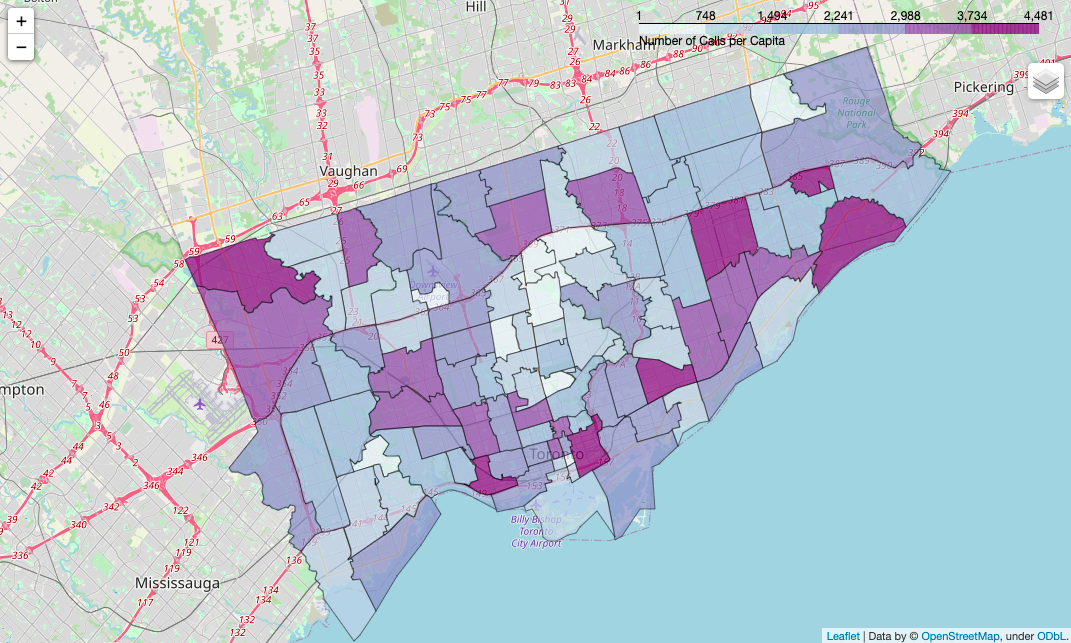
2.0 Toronto Population, 2016
url = (
    "https://raw.githubusercontent.com/BlizzWiz/IBM_Capstone_Project/master"
)
call_geo = f"{url}/toronto_m.geojson"

m = folium.Map(location=[43.7000, -79.3832], zoom_start=10)

folium.Choropleth(
    geo_data=call_geo,
    name="choropleth",
    data=call_counts,
    columns=["FSA", "population"],
    key_on="feature.properties.CFSAUID",
    fill_color="BuPu",
    fill_opacity=0.7,
    line_opacity=0.5,
    legend_name="Population",
).add_to(m)

folium.LayerControl().add_to(m)

m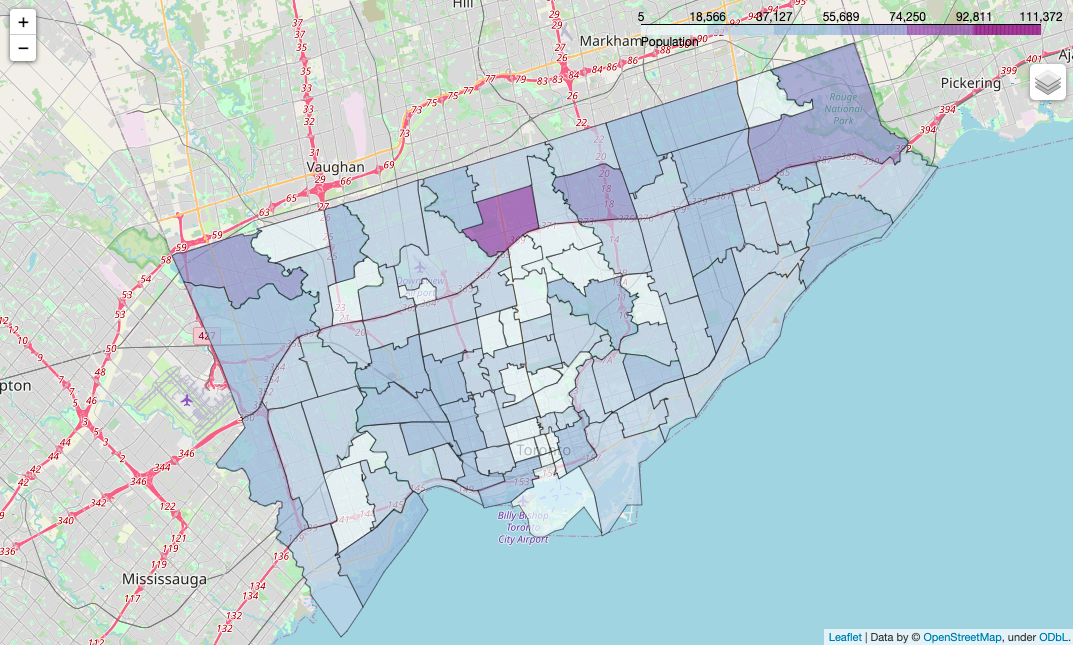
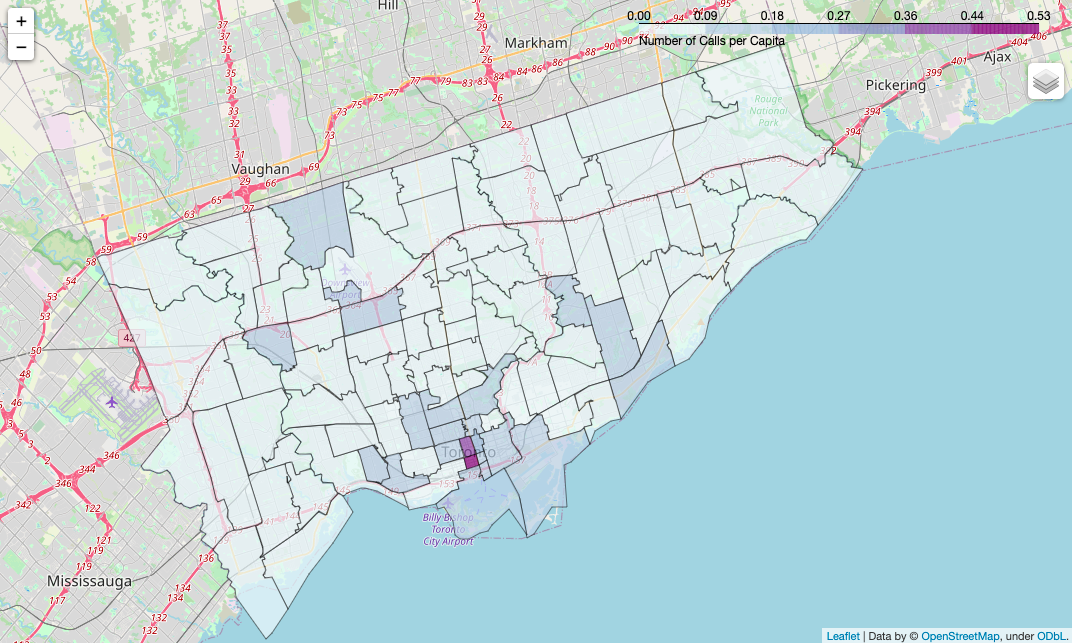
3.0 Number of Dispatches per Capita
url = (
    "https://raw.githubusercontent.com/BlizzWiz/IBM_Capstone_Project/master"
)
call_geo = f"{url}/toronto_m.geojson"

m = folium.Map(location=[43.7000, -79.3832], zoom_start=10)

folium.Choropleth(
    geo_data=call_geo,
    name="choropleth",
    data=call_counts,
    columns=["FSA", "call_per_capita"],
    key_on="feature.properties.CFSAUID",
    fill_color="BuPu",
    fill_opacity=0.7,
    line_opacity=0.5,
    legend_name="Number of Calls per Capita",
).add_to(m)

folium.LayerControl().add_to(m)

m